Repository navigation

Replies: 5 comments 1 reply

|
|
0 replies

|
不行的呢,还是和之前一样的效果 |
0 replies
|
可以看一下这个例子哈: import { Chart } from '@antv/g2';
import { feature } from 'topojson';
Promise.all([
// fetch('https://gw.alipayobjects.com/os/antvdemo/assets/data/china-provinces.geo.json')
fetch('https://geojson.cn/api/data/china.topo.json') // t
// fetch('https://geojson.cn/api/data/china.json')
.then((res) => res.json()),
]).then((values) => {
const [chian] = values;
// topo 转换成 geo json
const counties = feature(chian, chian.objects.default).features;
const chart = new Chart({
container: 'container',
theme: 'classic',
width: 1000,
height: 1000,
});
const geoView = chart.geoView().coordinate({ type: 'mercator' });
const nameValue = {
新疆:100,
}
geoView
.geoPath()
.data(counties)
.encode('latitude', 'latitude')
.encode('longitude', 'longitude')
.encode('color', (d) => nameValue[d.properties.name] || 0)
.scale("color", {
relations:[[0, '#fff']]
})
.style("stroke", "#aaa")
// .scale('color', {
// palette: 'ylGnBu',
// unknown: '#fff',
// });
geoView
.text()
.data(counties.filter((d) => d.properties.centroid))
.encode('x', (d) => {
const [x] = d.properties.centroid;
return x;
})
.encode('y', (d) => {
const [_, y] = d.properties.centroid;
return y;
})
.encode('text', (d) => {
const name = d.properties.name;
console.log('name', name);
return d.properties.name;
})
// .style('color', 'black')
.style('fontSize', 12)
.style('textAlign', 'center')
.style("fill", d => (nameValue[d.properties.name] || 0) === 0 ? 'black':"white")
.style('opacity', 1);
geoView.legend(false);
chart.render();
}); |
1 reply

|
你好,请问你知道怎么改中国地图的tooltip么?以你这里的代码的话.想实现鼠标滑过某个省,展示省的某些数量信息 |
|
可以了,谢谢,我使用的是你提供的topojson数据转换后的geojson,但是从阿里云可视化平台下载的geojson数据就不可以,不知道什么原因 |
0 replies
|
@Azariasa 因为没有看见你的完整的代码,所以我暂时也不知道为啥,不过你可以比较一下你下载的数据和通过 topojson 转换而来的数据。 |
0 replies
Sign up for free
to join this conversation on GitHub.
Already have an account?
Sign in to comment


Uh oh!
There was an error while loading. Please reload this page.
问题描述
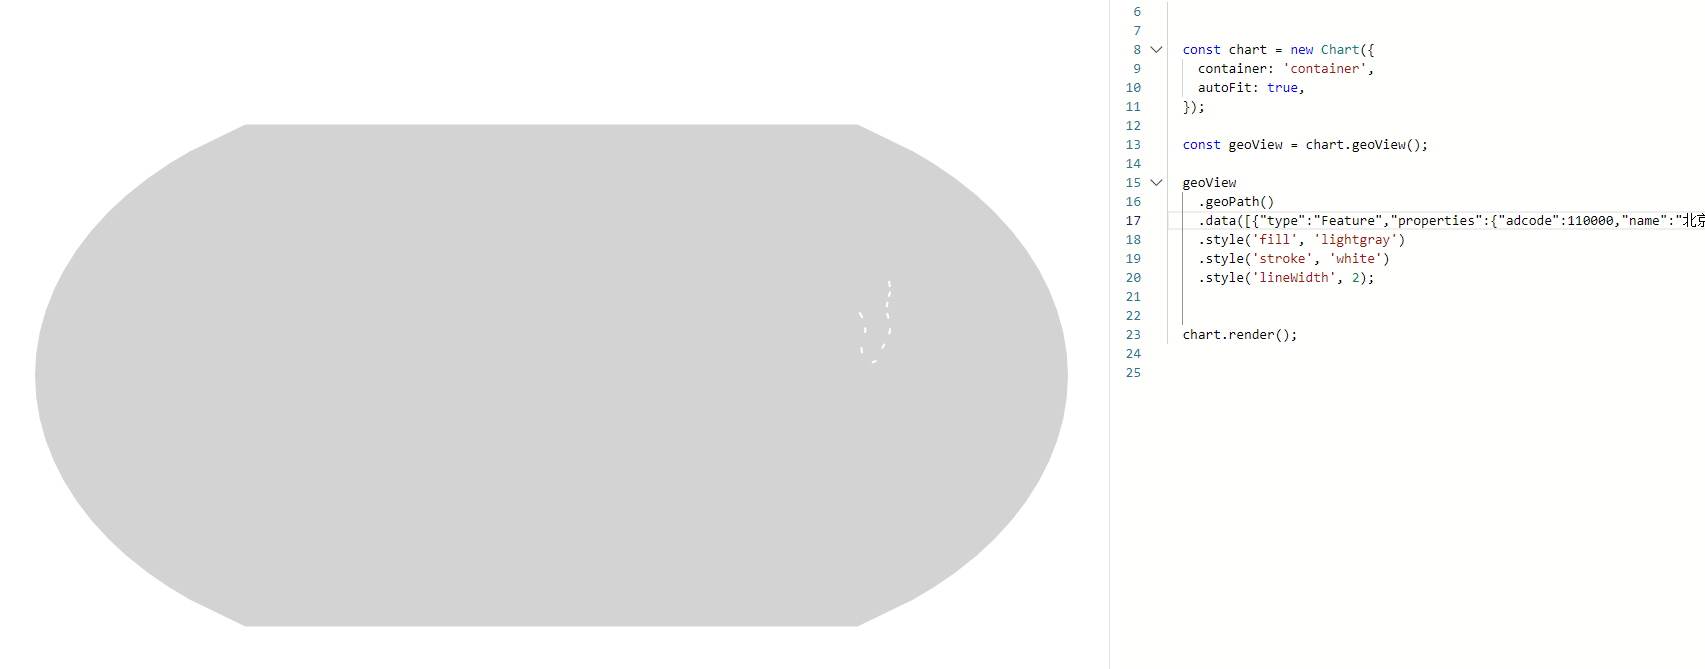
g2官网引入中国geojson文件,无法正常渲染
重现链接
No response
重现步骤
1、进入g2官方示例页面,https://g2.antv.antgroup.com/examples/geo/geo/#london-tube-lines
2、删除示例中数据代码,如图:
3、进入阿里云数据可视化平台(https://datav.aliyun.com/portal/school/atlas/area_selector),找到中国geojson文件(https://geo.datav.aliyun.com/areas_v3/bound/geojson?code=100000_full)
4、将json文件中的【features】字段所对应的值复制到示例中,如图:
5、示例无法正常渲染,如图:
预期行为
No response
平台
屏幕截图或视频(可选)
补充说明(可选)
No response
All reactions