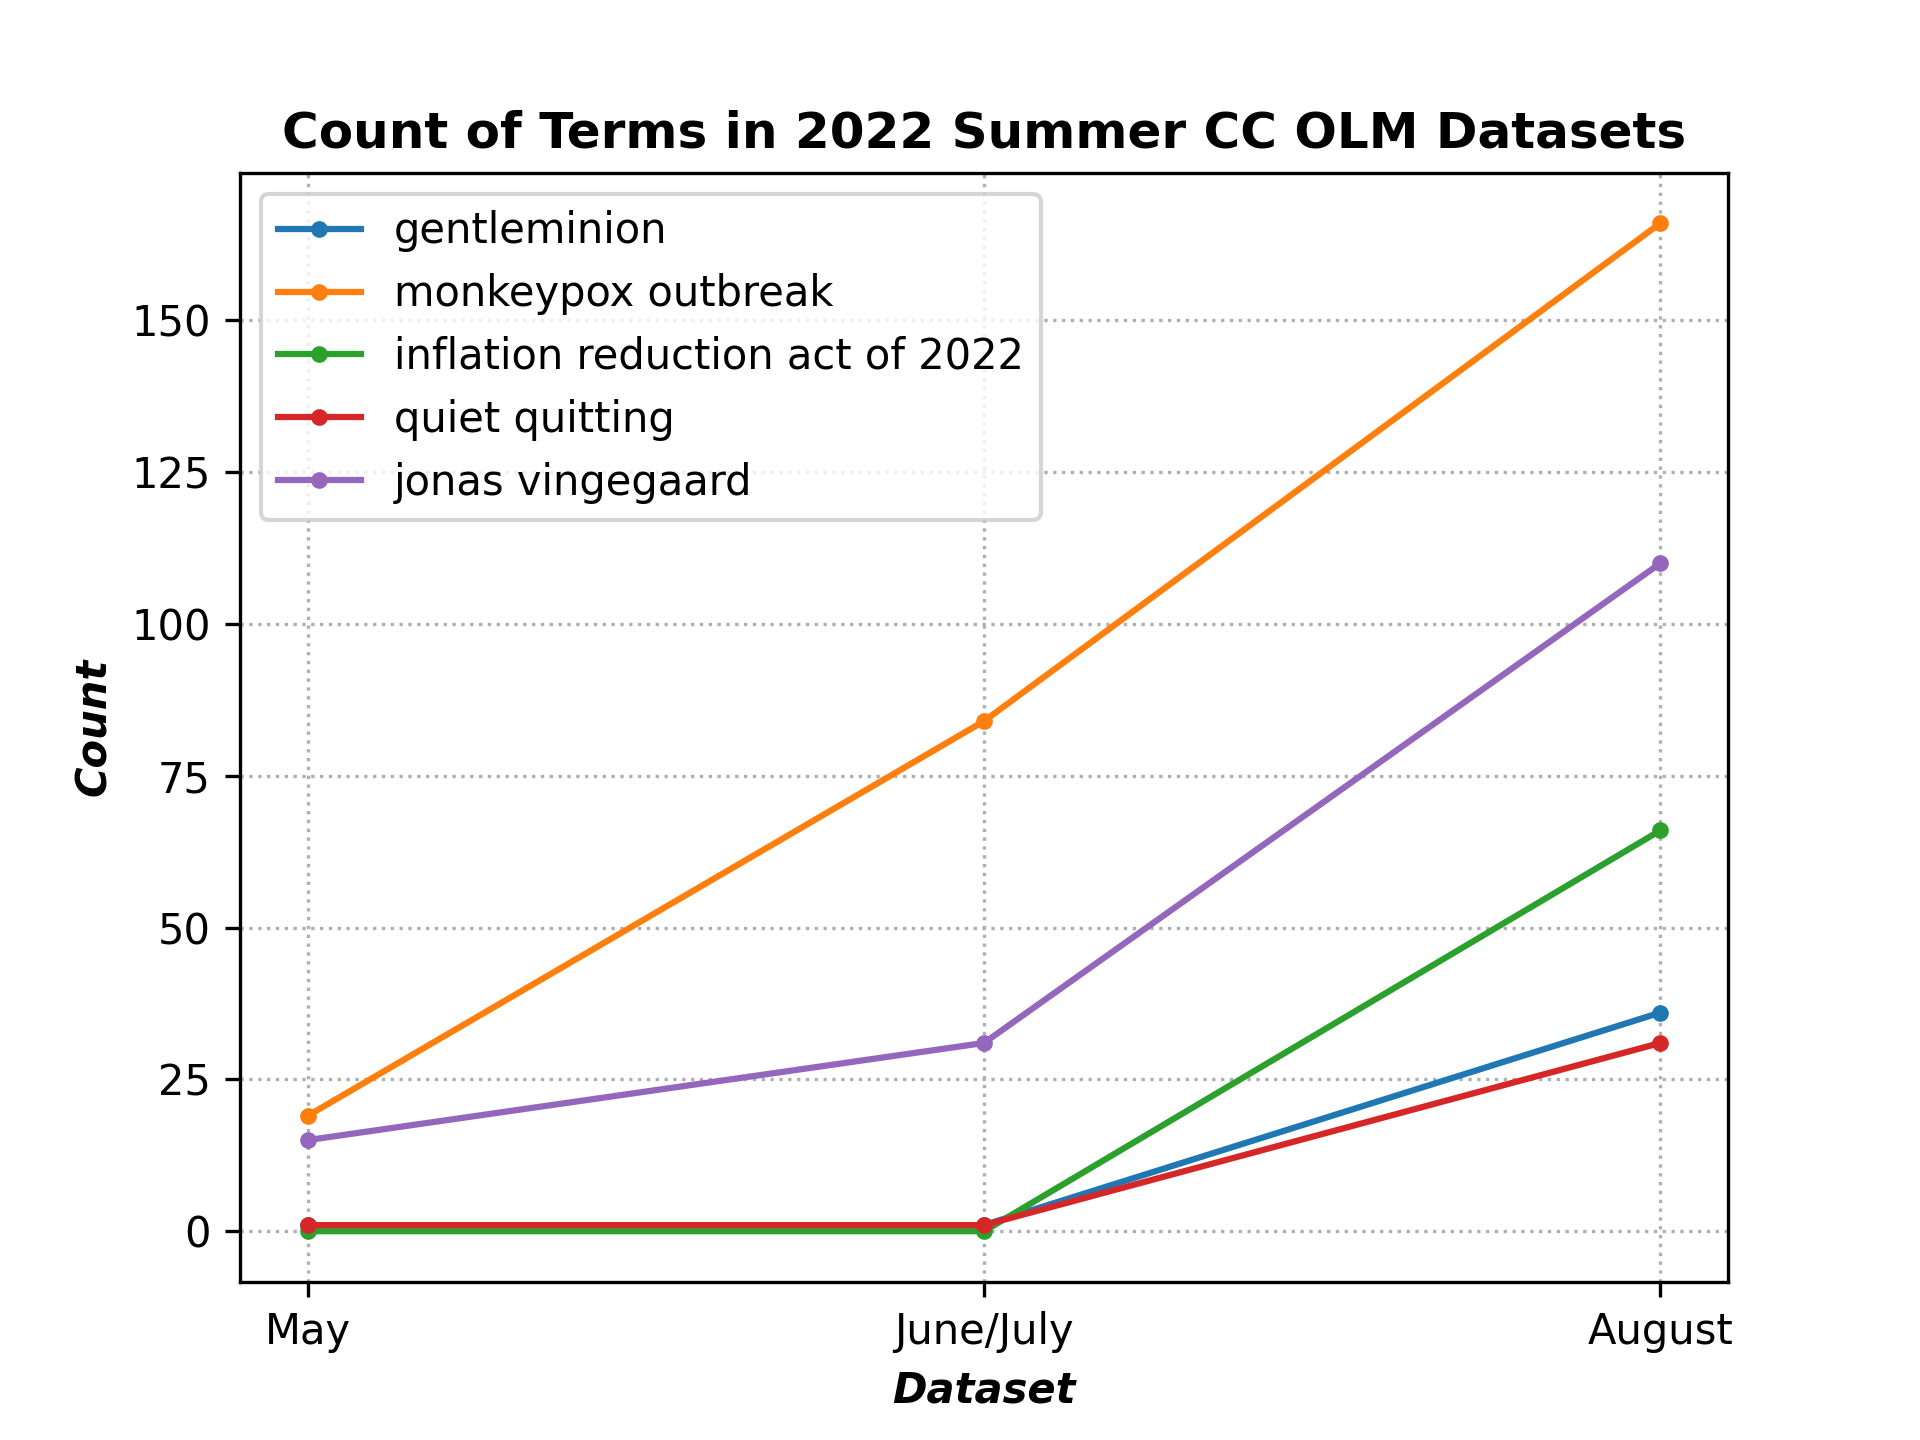
This command reports the count of terms associated with events that happened over summer 2022, accross chronologically ordered summer 2022 OLM datasets. We would expect the counts to go up over the summer:
python term_counts.py --input_dataset_names Tristan/olm-CC-MAIN-2022-21-sampling-ratio-0.14775510204 Tristan/olm-CC-MAIN-2022-27-sampling-ratio-0.16142697881 Tristan/olm-CC-MAIN-2022-33-sampling-ratio-0.20 --input_dataset_pretty_names "May" "June/July" "August" --terms "gentleminion" "monkeypox outbreak" "inflation reduction act of 2022" "quiet quitting" "jonas vingegaard" --plot_title="Count of Terms in 2022 Summer CC OLM Datasets" --analysis_column=text --split=train --num_proc=224 --output_filename=summer_2022_term_counts.png --load_from_hub_instead_of_disk --ylabel Count
Here is the resulting figure:
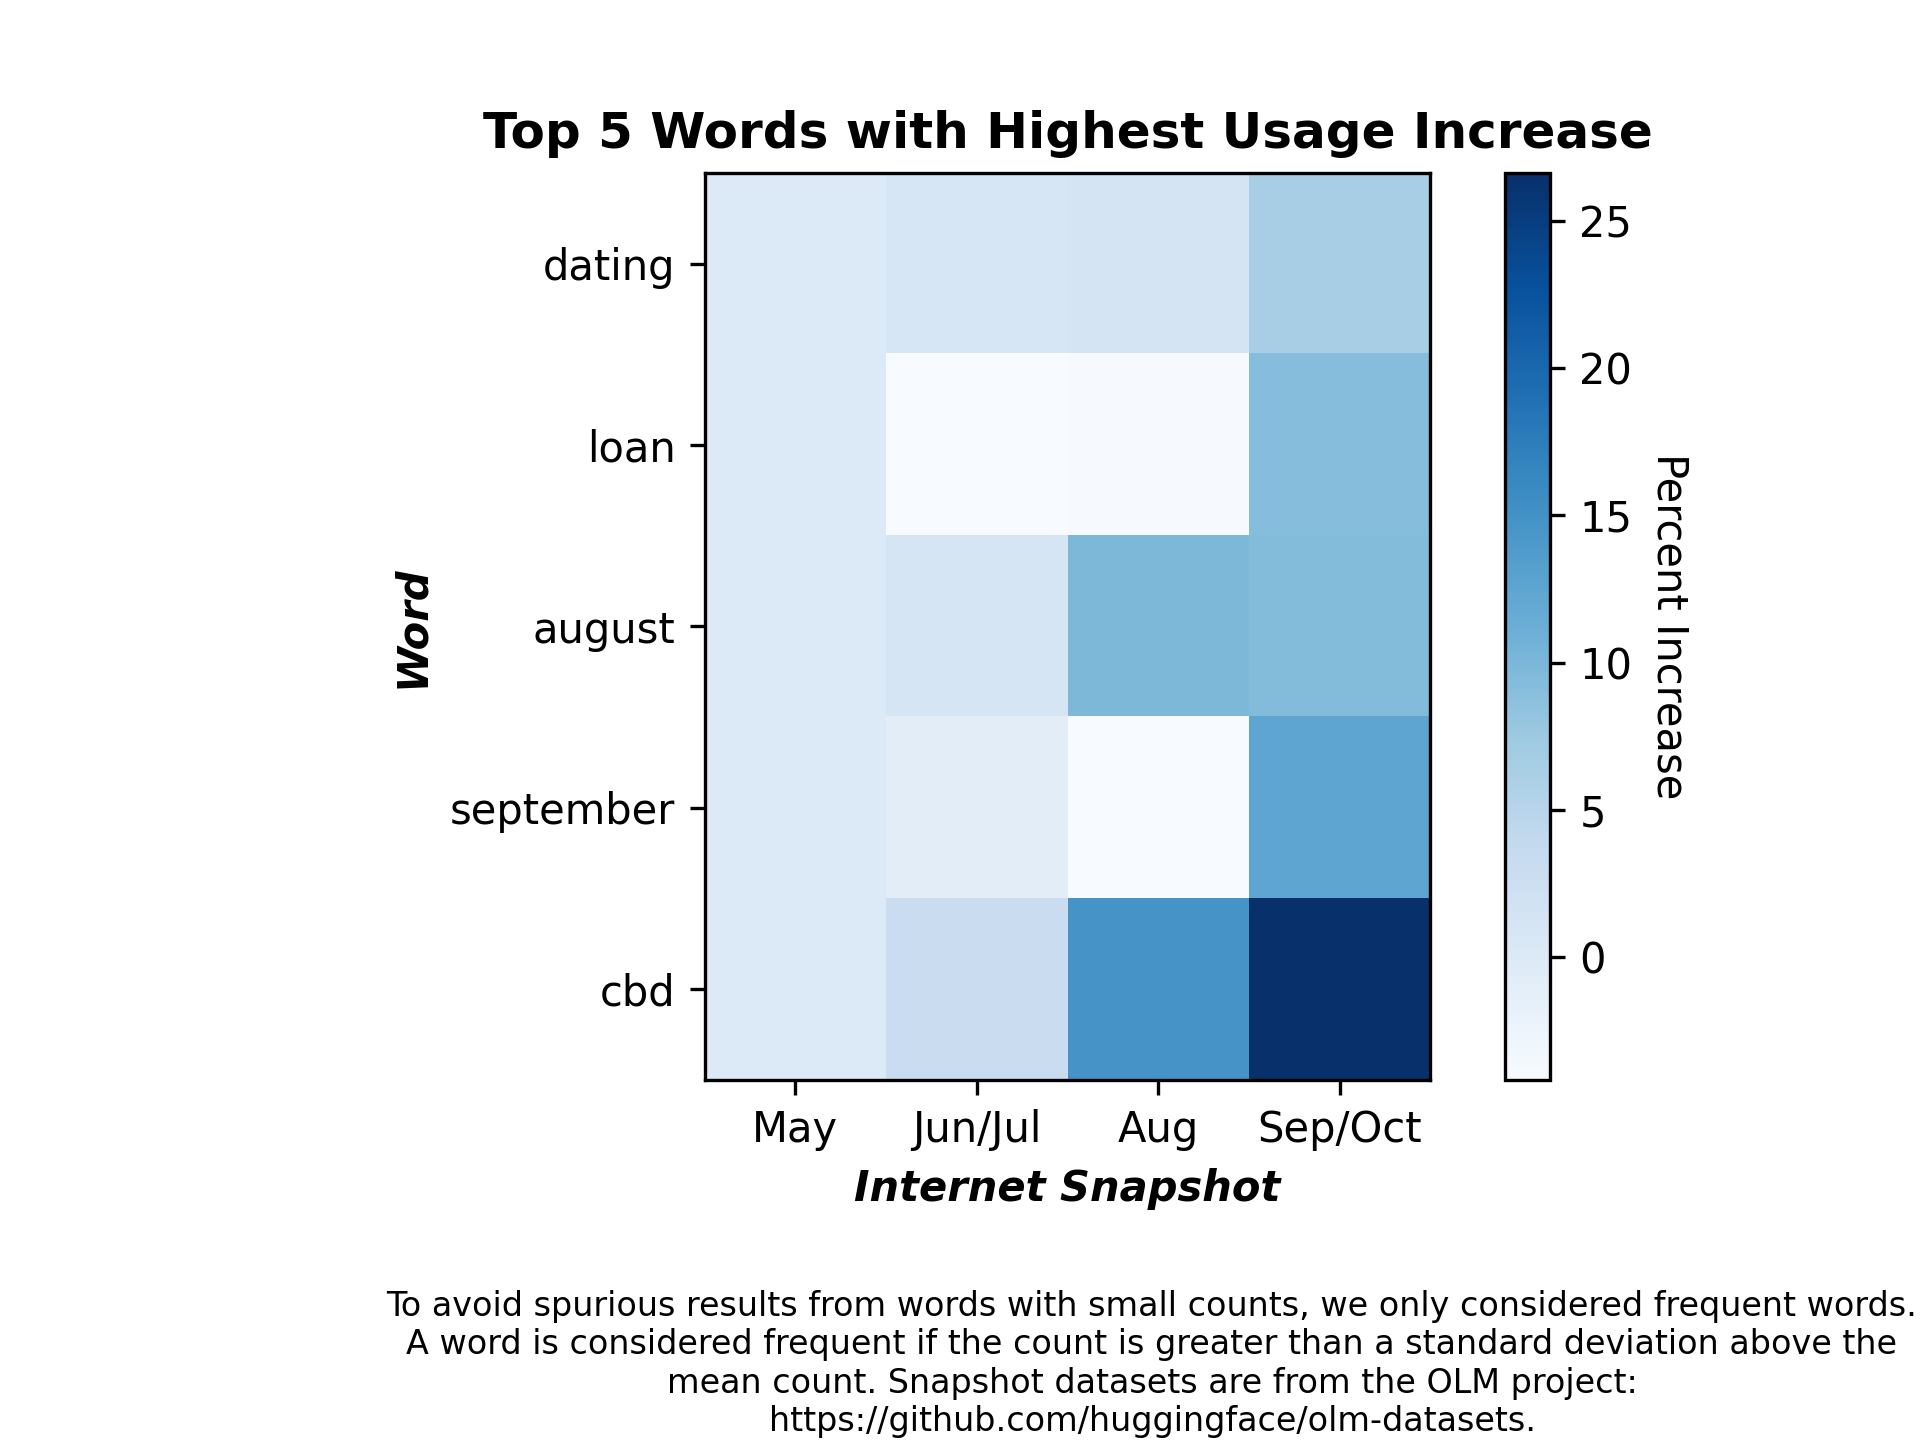
This command reports the count of words with the highest usage increase between the start of summer 2022 and the fall of 2022, out of all of the frequent (> mean + std) words in the dataset with only alphabetic characters, lowercased, and split by spaces:
python term_counts.py --input_dataset_names Tristan/olm-CC-MAIN-2022-21-sampling-ratio-0.14775510204 Tristan/olm-CC-MAIN-2022-27-sampling-ratio-0.16142697881 Tristan/olm-CC-MAIN-2022-33-sampling-ratio-0.20 Tristan/olm-CC-MAIN-2022-40-sampling-ratio-0.15894621295 --input_dataset_pretty_names "May" "Jun/Jul" "Aug" "Sep/Oct" --num_terms_to_find 5 --plot_title="Top 5 Words with Highest Usage Increase" --analysis_column=text --split=train --num_proc=224 --output_filename=top_5_term_counts_heatmap.png --load_from_hub_instead_of_disk --ylabel "Word" --as_heatmap --heatmap_bar_label "Percent Increase" --xlabel "Internet Snapshot" --normalize_axis=1 --cache_dir=term_counts_cache_top_5 --percent_increase --annotation "To avoid spurious results from words with small counts, we only considered frequent words. A word is considered frequent if the count is greater than a standard deviation above the mean count. Snapshot datasets are from the OLM project: https://github.com/huggingface/olm-datasets."
Here is the resulting figure:
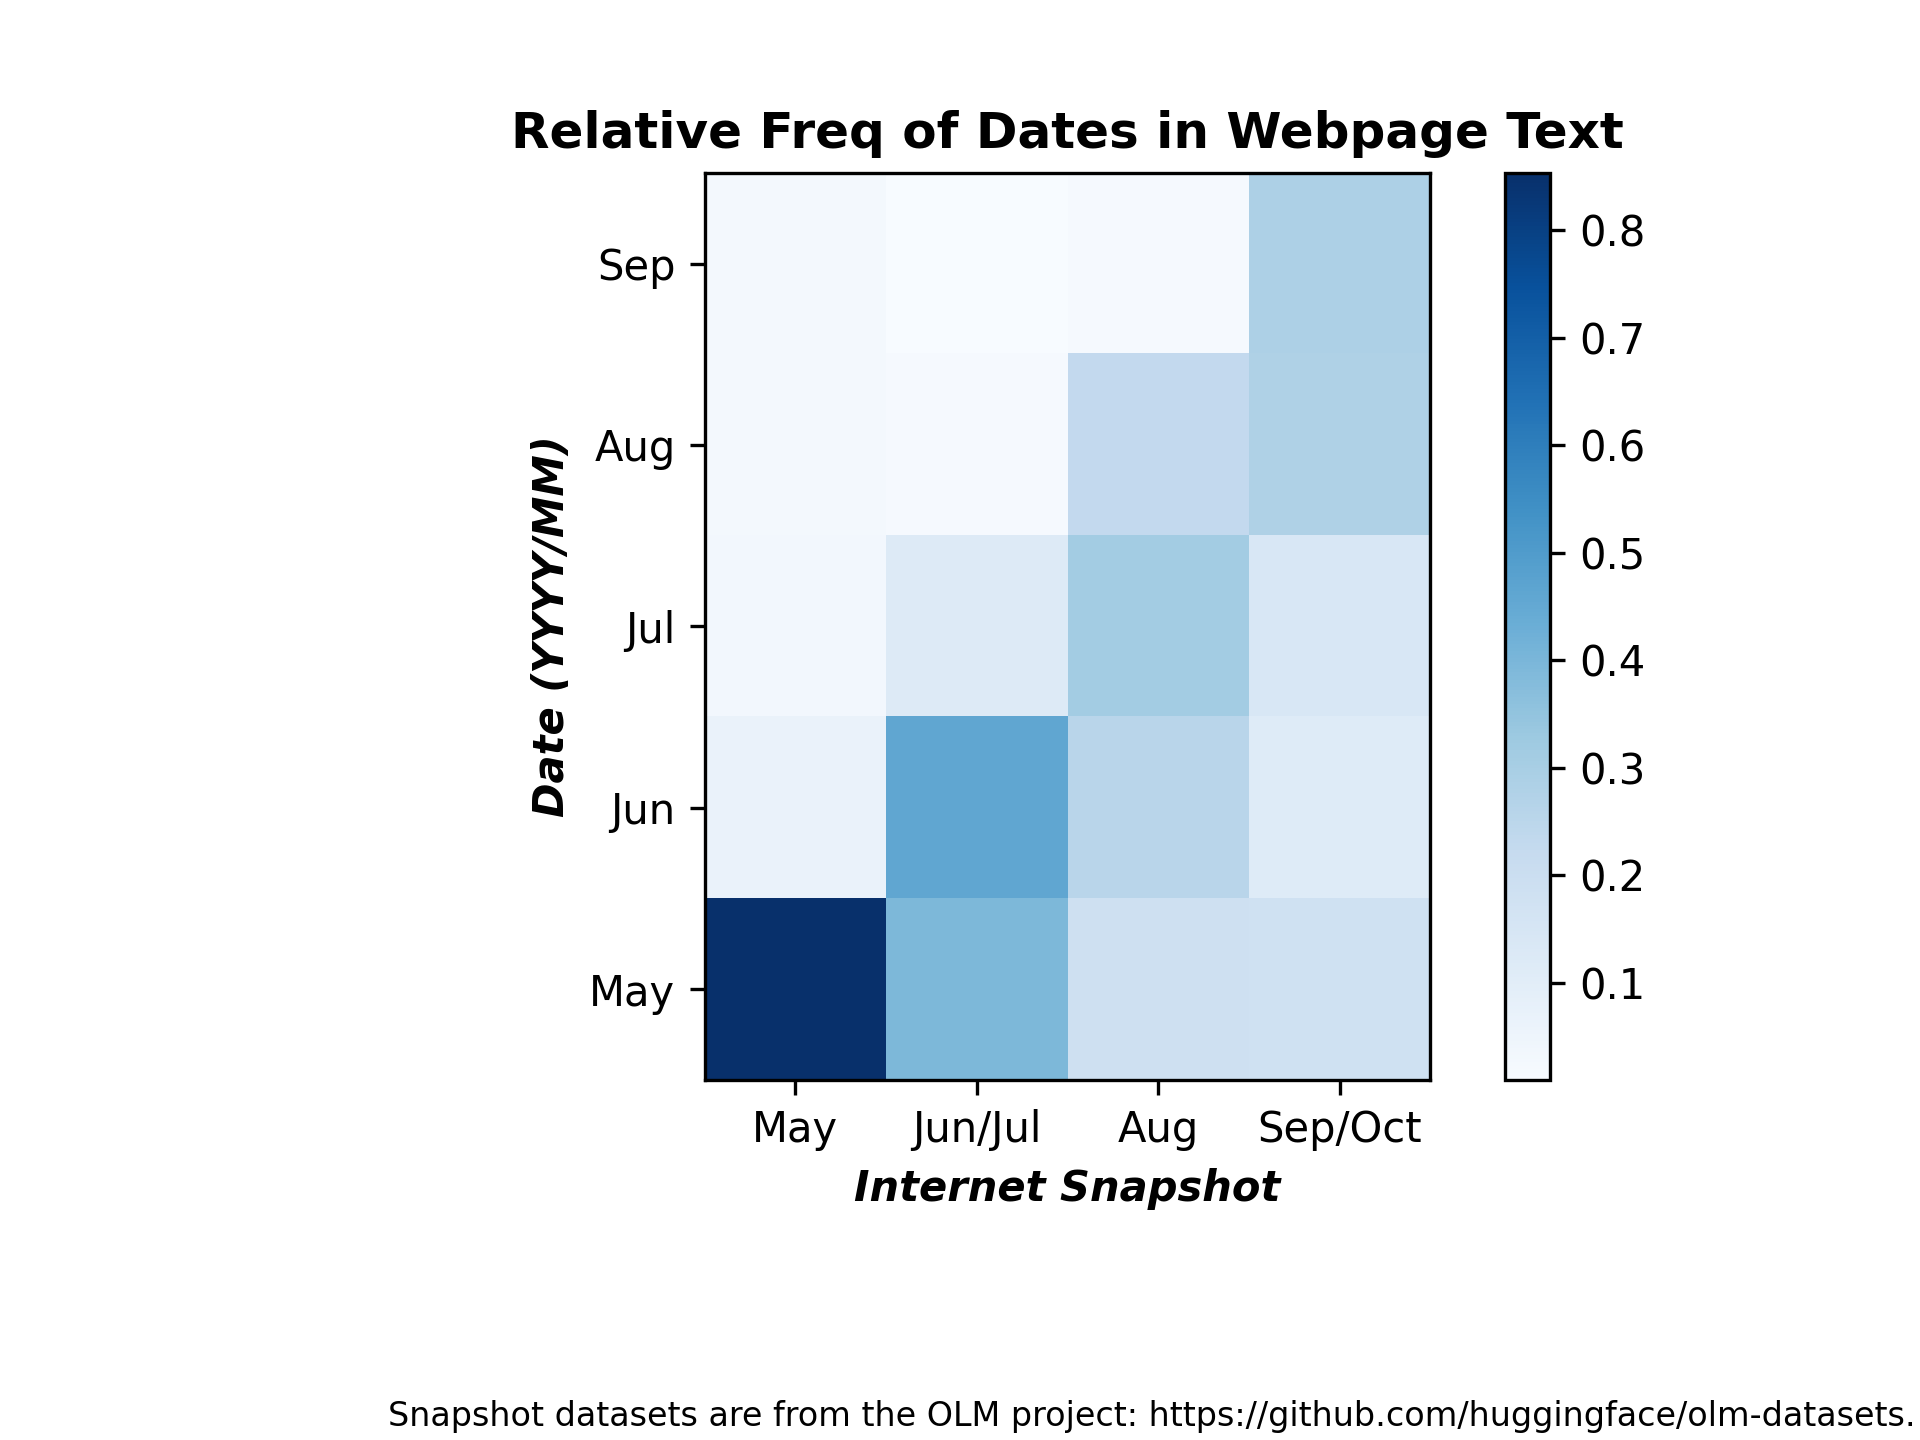
This command reports the count of date mentions in the text between summer 2022 and fall 2022:
python term_counts.py --input_dataset_names Tristan/olm-CC-MAIN-2022-21-sampling-ratio-0.14775510204 Tristan/olm-CC-MAIN-2022-27-sampling-ratio-0.16142697881 Tristan/olm-CC-MAIN-2022-33-sampling-ratio-0.20 Tristan/olm-CC-MAIN-2022-40-sampling-ratio-0.15894621295 --input_dataset_pretty_names "May" "Jun/Jul" "Aug" "Sep/Oct" --terms 2022/05 2022/06 2022/07 2022/08 2022/09 --plot_title="Relative Freq of Dates in Webpage Text" --analysis_column=text --split=train --num_proc=224 --output_filename=date_term_counts_heatmap_text.png --load_from_hub_instead_of_disk --as_heatmap --ylabel "Date (YYYY/MM)" --term_pretty_names May Jun Jul Aug Sep --cache_dir term_counts_cache_date_text --xlabel "Internet Snapshot" --annotation "Snapshot datasets are from the OLM project: https://github.com/huggingface/olm-datasets." --normalize
Here is the resulting figure:
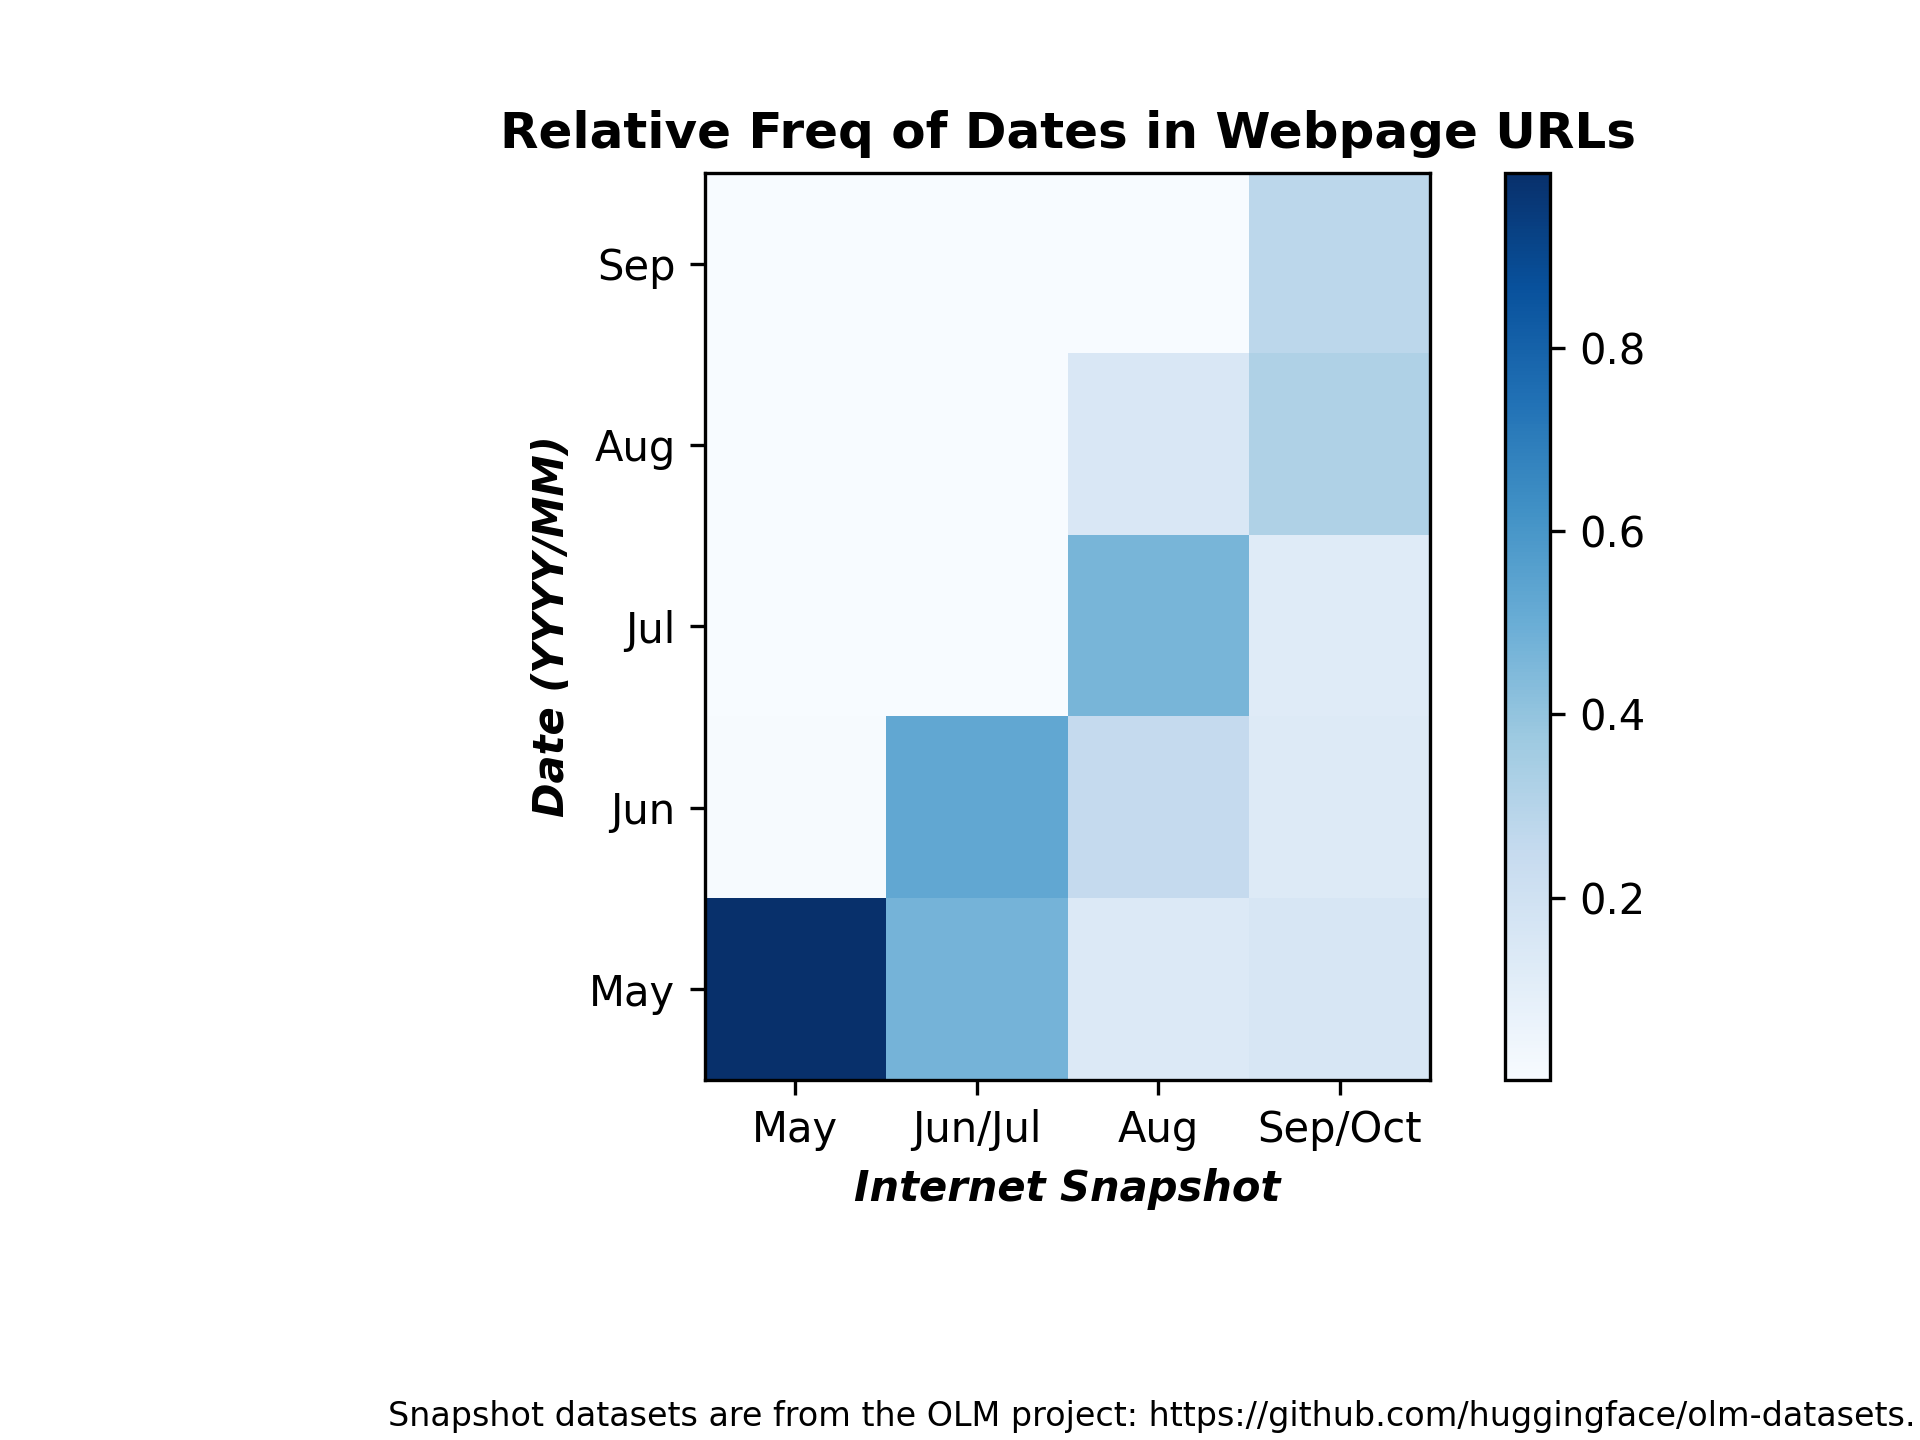
This command reports the count of date mentions in the URLs between summer 2022 and fall 2022:
python term_counts.py --input_dataset_names Tristan/olm-CC-MAIN-2022-21-sampling-ratio-0.14775510204 Tristan/olm-CC-MAIN-2022-27-sampling-ratio-0.16142697881 Tristan/olm-CC-MAIN-2022-33-sampling-ratio-0.20 Tristan/olm-CC-MAIN-2022-40-sampling-ratio-0.15894621295 --input_dataset_pretty_names "May" "Jun/Jul" "Aug" "Sep/Oct" --terms 2022/05 2022/06 2022/07 2022/08 2022/09 --plot_title="Relative Freq of Dates in Webpage URLs" --analysis_column=url --split=train --num_proc=224 --output_filename=date_term_counts_heatmap_url.png --load_from_hub_instead_of_disk --as_heatmap --ylabel "Date (YYYY/MM)" --term_pretty_names May Jun Jul Aug Sep --cache_dir term_counts_cache_date_urls --xlabel "Internet Snapshot" --annotation "Snapshot datasets are from the OLM project: https://github.com/huggingface/olm-datasets." --normalize
Here is the resulting figure:
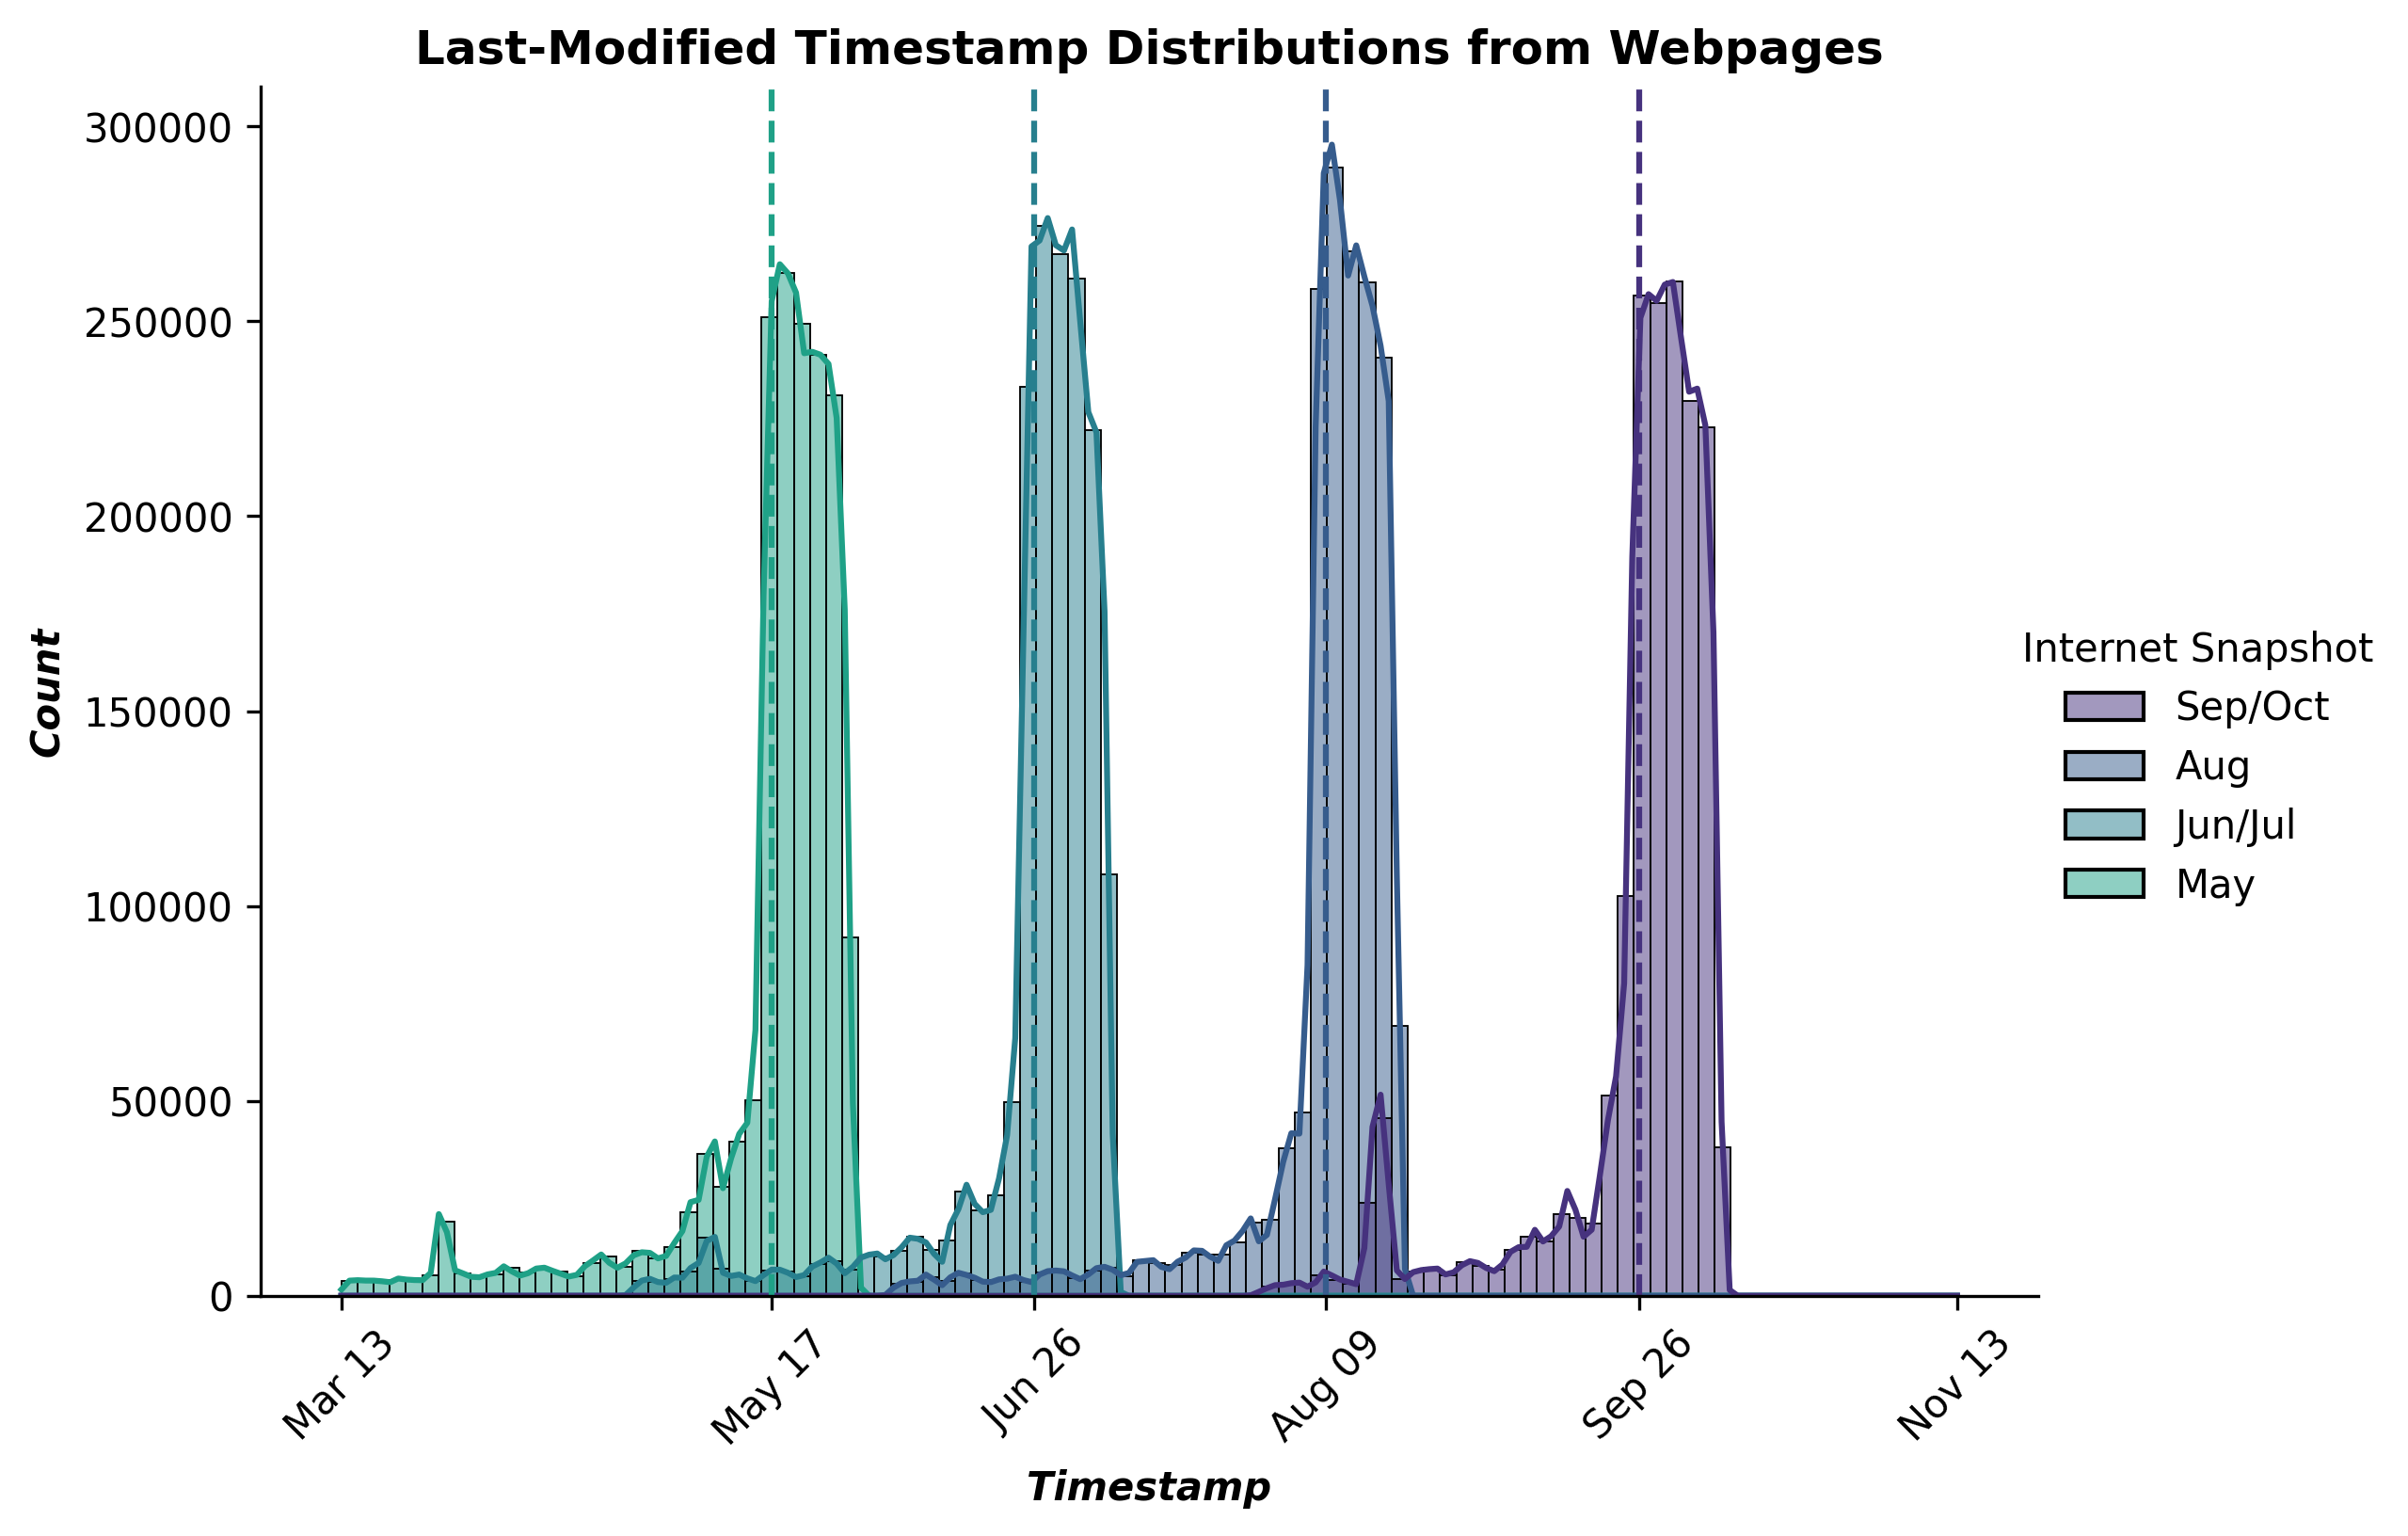
This command reports the last-modified timestamp distribution for the summer 2022 through fall 2022 OLM CC datasets:
python timestamp_dist.py --input_dataset_names Tristan/olm-CC-MAIN-2022-40-sampling-ratio-0.15894621295 Tristan/olm-CC-MAIN-2022-33-sampling-ratio-0.20 Tristan/olm-CC-MAIN-2022-27-sampling-ratio-0.16142697881 Tristan/olm-CC-MAIN-2022-21-sampling-ratio-0.14775510204 --input_dataset_pretty_names Sep/Oct Aug Jun/Jul May --timestamp_column last_modified_timestamp --plot_title "Last-Modified Timestamp Distributions from Webpages" --num_proc=224 --output_filename last_modified_dist.png --load_from_hub_instead_of_disk --cache_dir timestamp_dist_cache_last_modified --split=train
Here is the resulting figure:
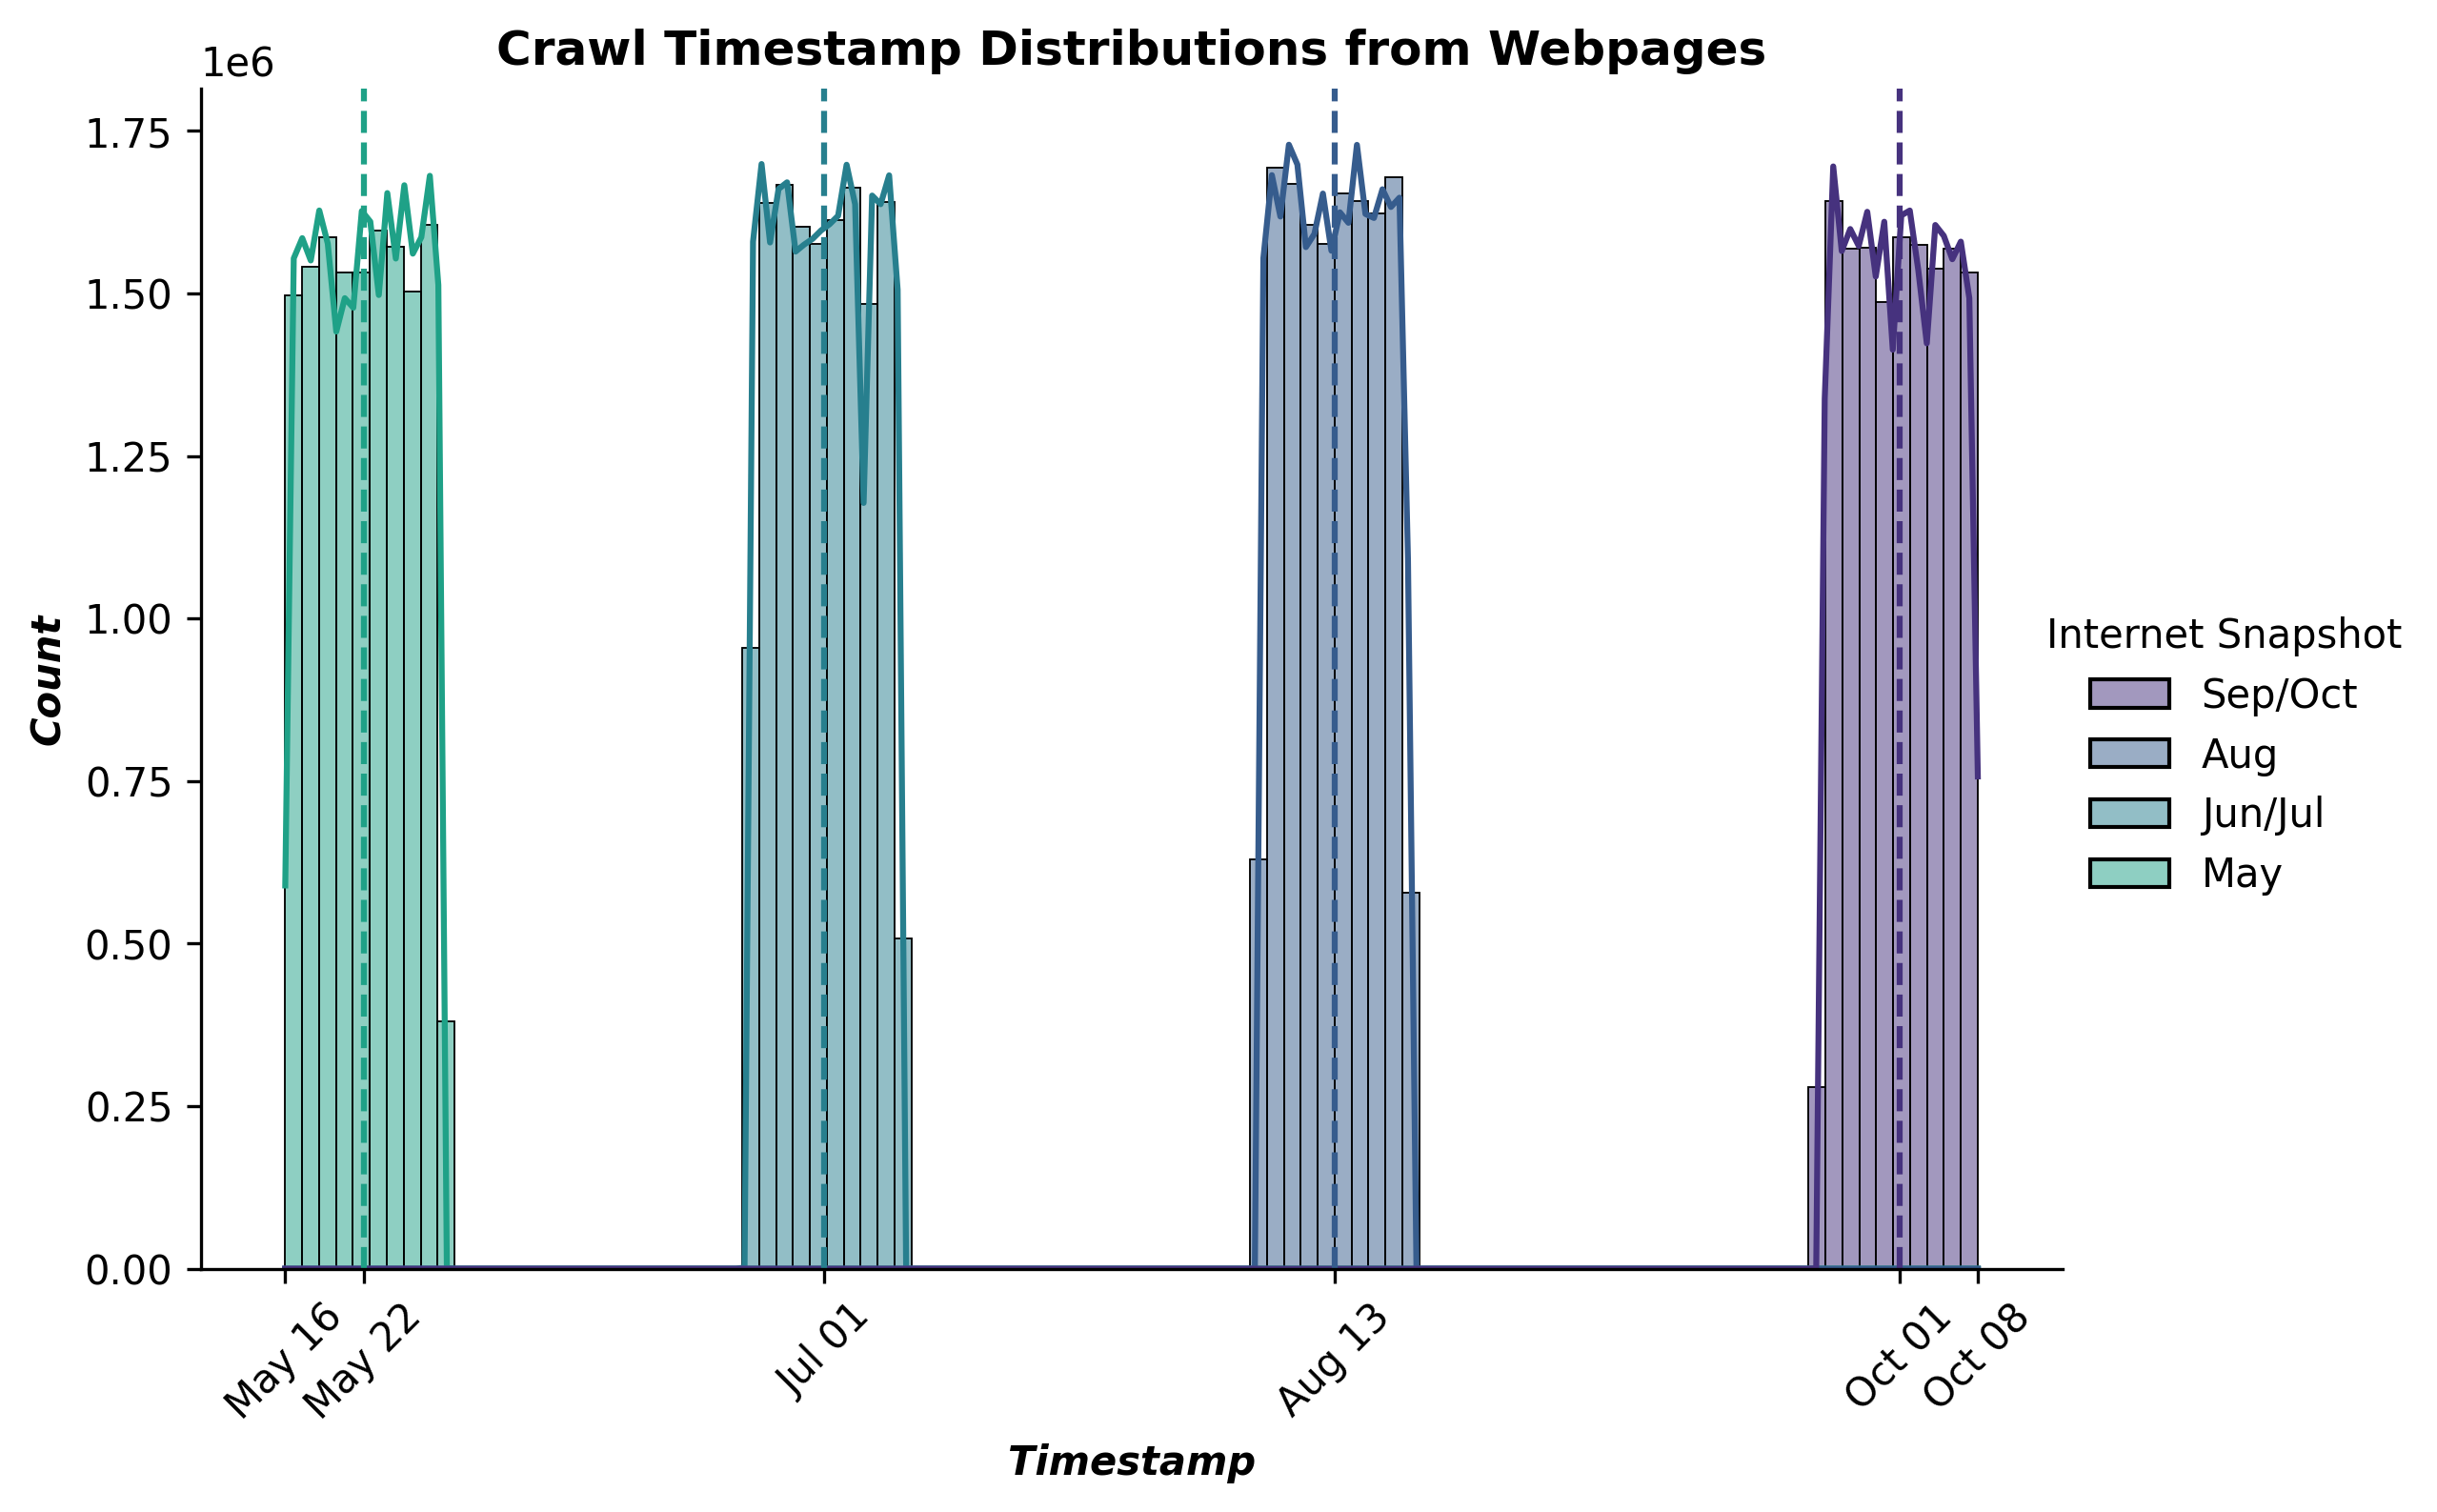
This command reports the crawl timestamp distribution for the summer 2022 through fall 2022 OLM CC datasets:
python timestamp_dist.py --input_dataset_names Tristan/olm-CC-MAIN-2022-40-sampling-ratio-0.15894621295 Tristan/olm-CC-MAIN-2022-33-sampling-ratio-0.20 Tristan/olm-CC-MAIN-2022-27-sampling-ratio-0.16142697881 Tristan/olm-CC-MAIN-2022-21-sampling-ratio-0.14775510204 --input_dataset_pretty_names Sep/Oct Aug Jun/Jul May --timestamp_column crawl_timestamp --plot_title "Crawl Timestamp Distributions from Webpages" --num_proc=224 --output_filename crawl_dist.png --load_from_hub_instead_of_disk --cache_dir timestamp_dist_cache_crawl --split=train
Here is the resulting figure:
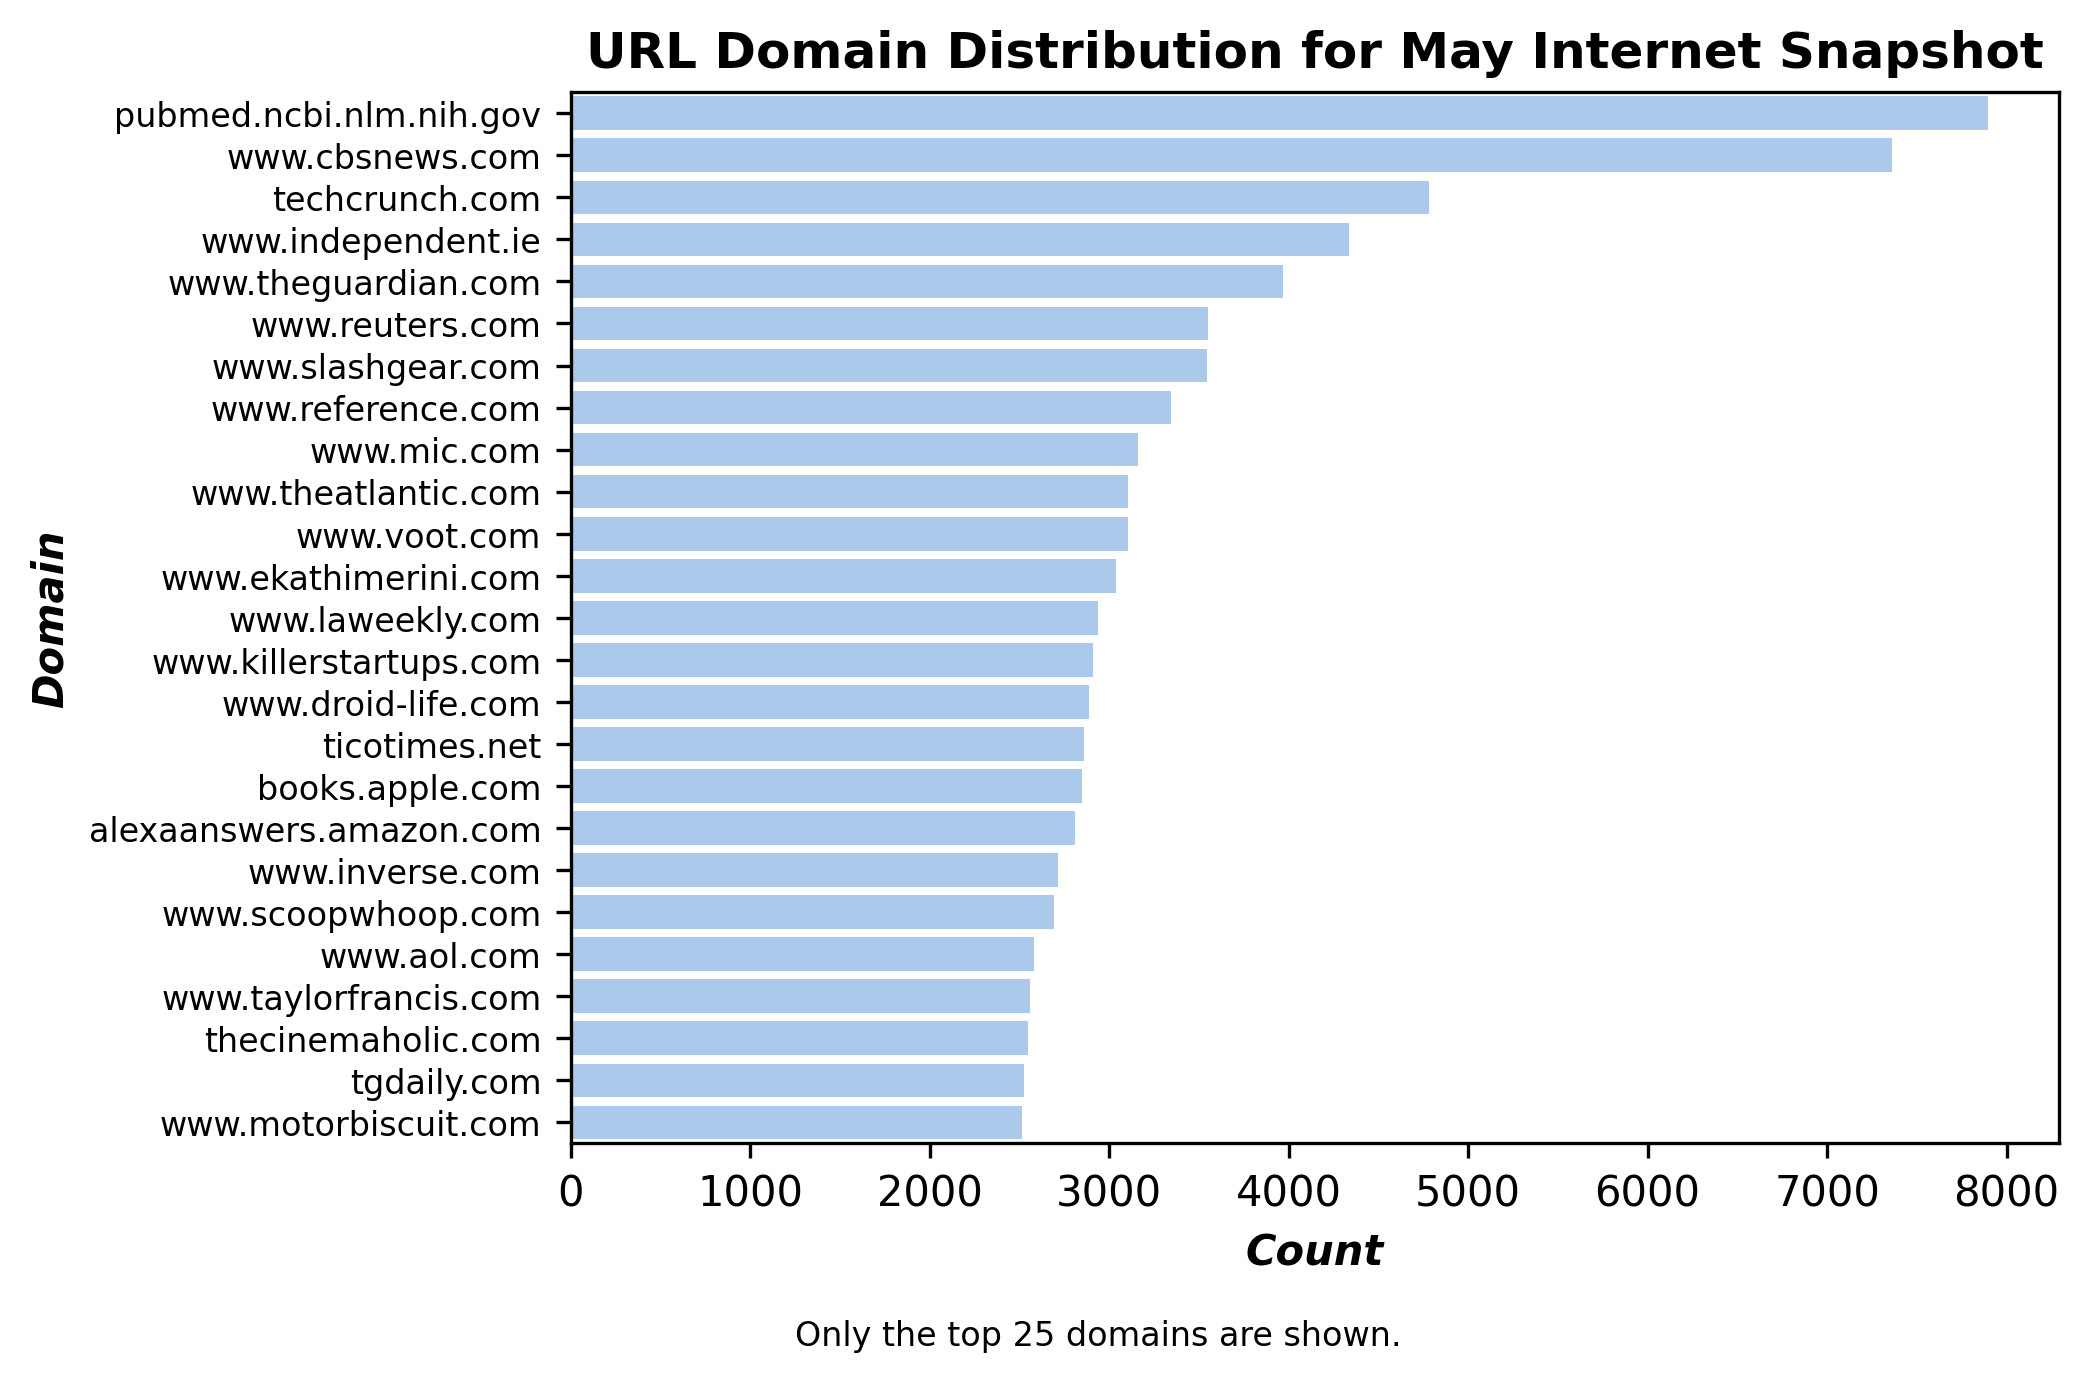
This command reports the domain distribution within the May 2022 OLM CC dataset:
python url_dist.py --input_dataset_names Tristan/olm-CC-MAIN-2022-21-sampling-ratio-0.14775510204 --input_dataset_pretty_names May --url_column url --hist_plot_title "URL Domain Distribution for May Internet Snapshot" --corr_plot_title "URL Domain Distribution Corr for May Internet Snapshot" --num_proc=224 --output_corr_filename url_corr_may.png --output_hist_filename url_hist_may.png --load_from_hub_instead_of_disk --cache_dir url_dist_cache_may --no_hist_legend --annotation "Only the top 25 domains are shown."
Here is the resulting figure:
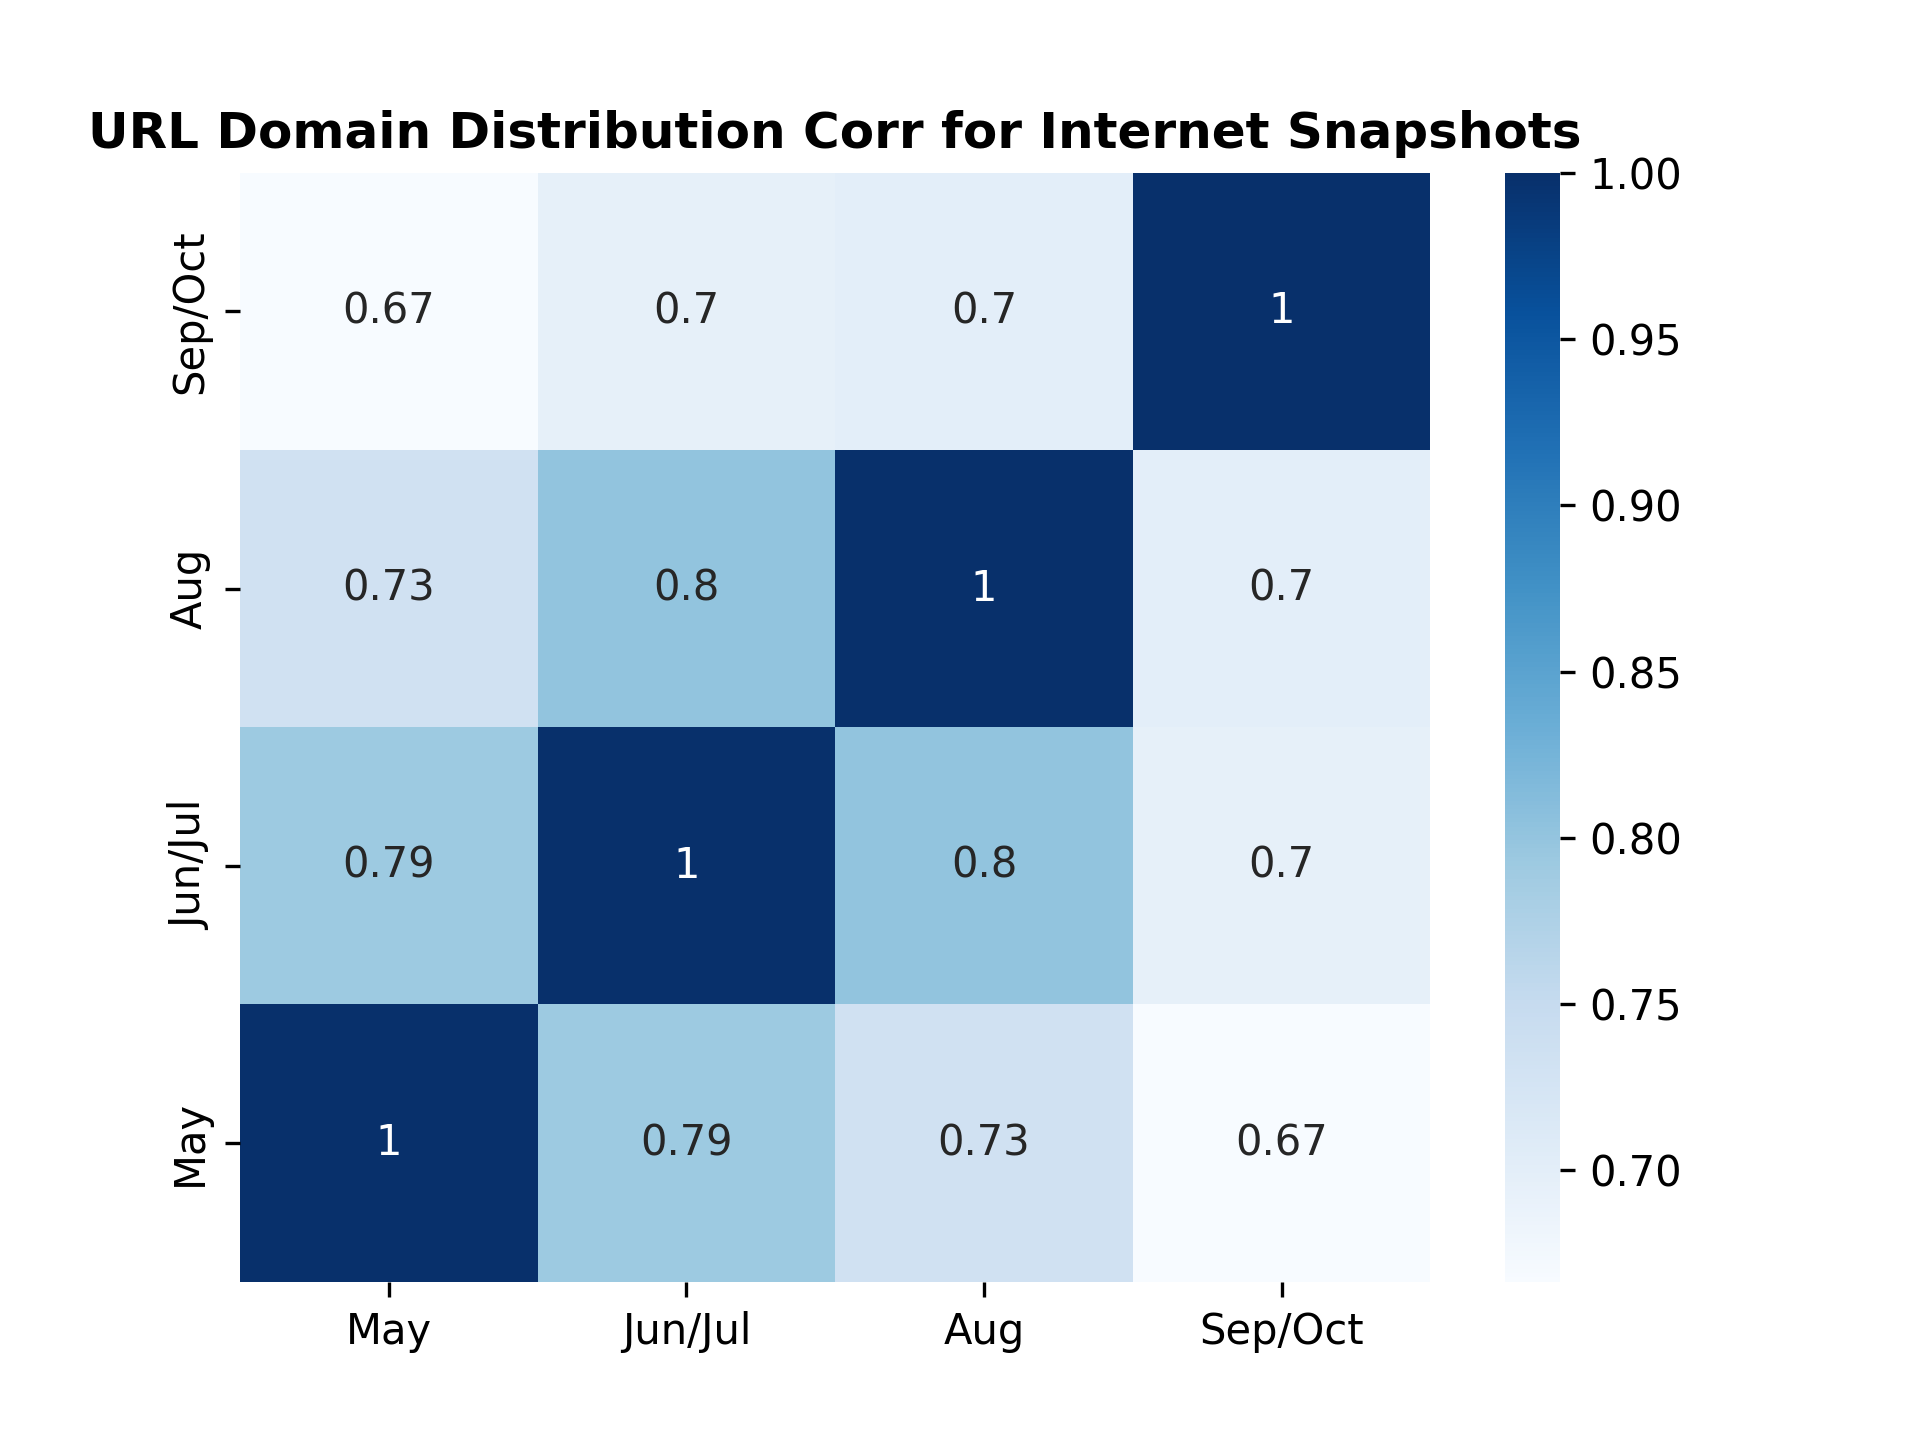
This command reports the domain correlations between the summer 2022 through fall 2022 OLM CC datasets:
python url_dist.py --input_dataset_names Tristan/olm-CC-MAIN-2022-21-sampling-ratio-0.14775510204 Tristan/olm-CC-MAIN-2022-27-sampling-ratio-0.16142697881 Tristan/olm-CC-MAIN-2022-33-sampling-ratio-0.20 Tristan/olm-CC-MAIN-2022-40-sampling-ratio-0.15894621295 --input_dataset_pretty_names May Jun/Jul Aug Sep/Oct --url_column url --hist_plot_title "URL Domain Distribution for Internet Snapshots" --corr_plot_title "URL Domain Distribution Corr for Internet Snapshots" --num_proc=224 --output_corr_filename url_corr.png --output_hist_filename url_hist.png --load_from_hub_instead_of_disk --cache_dir url_dist_cache_all
Here is the resulting figure:
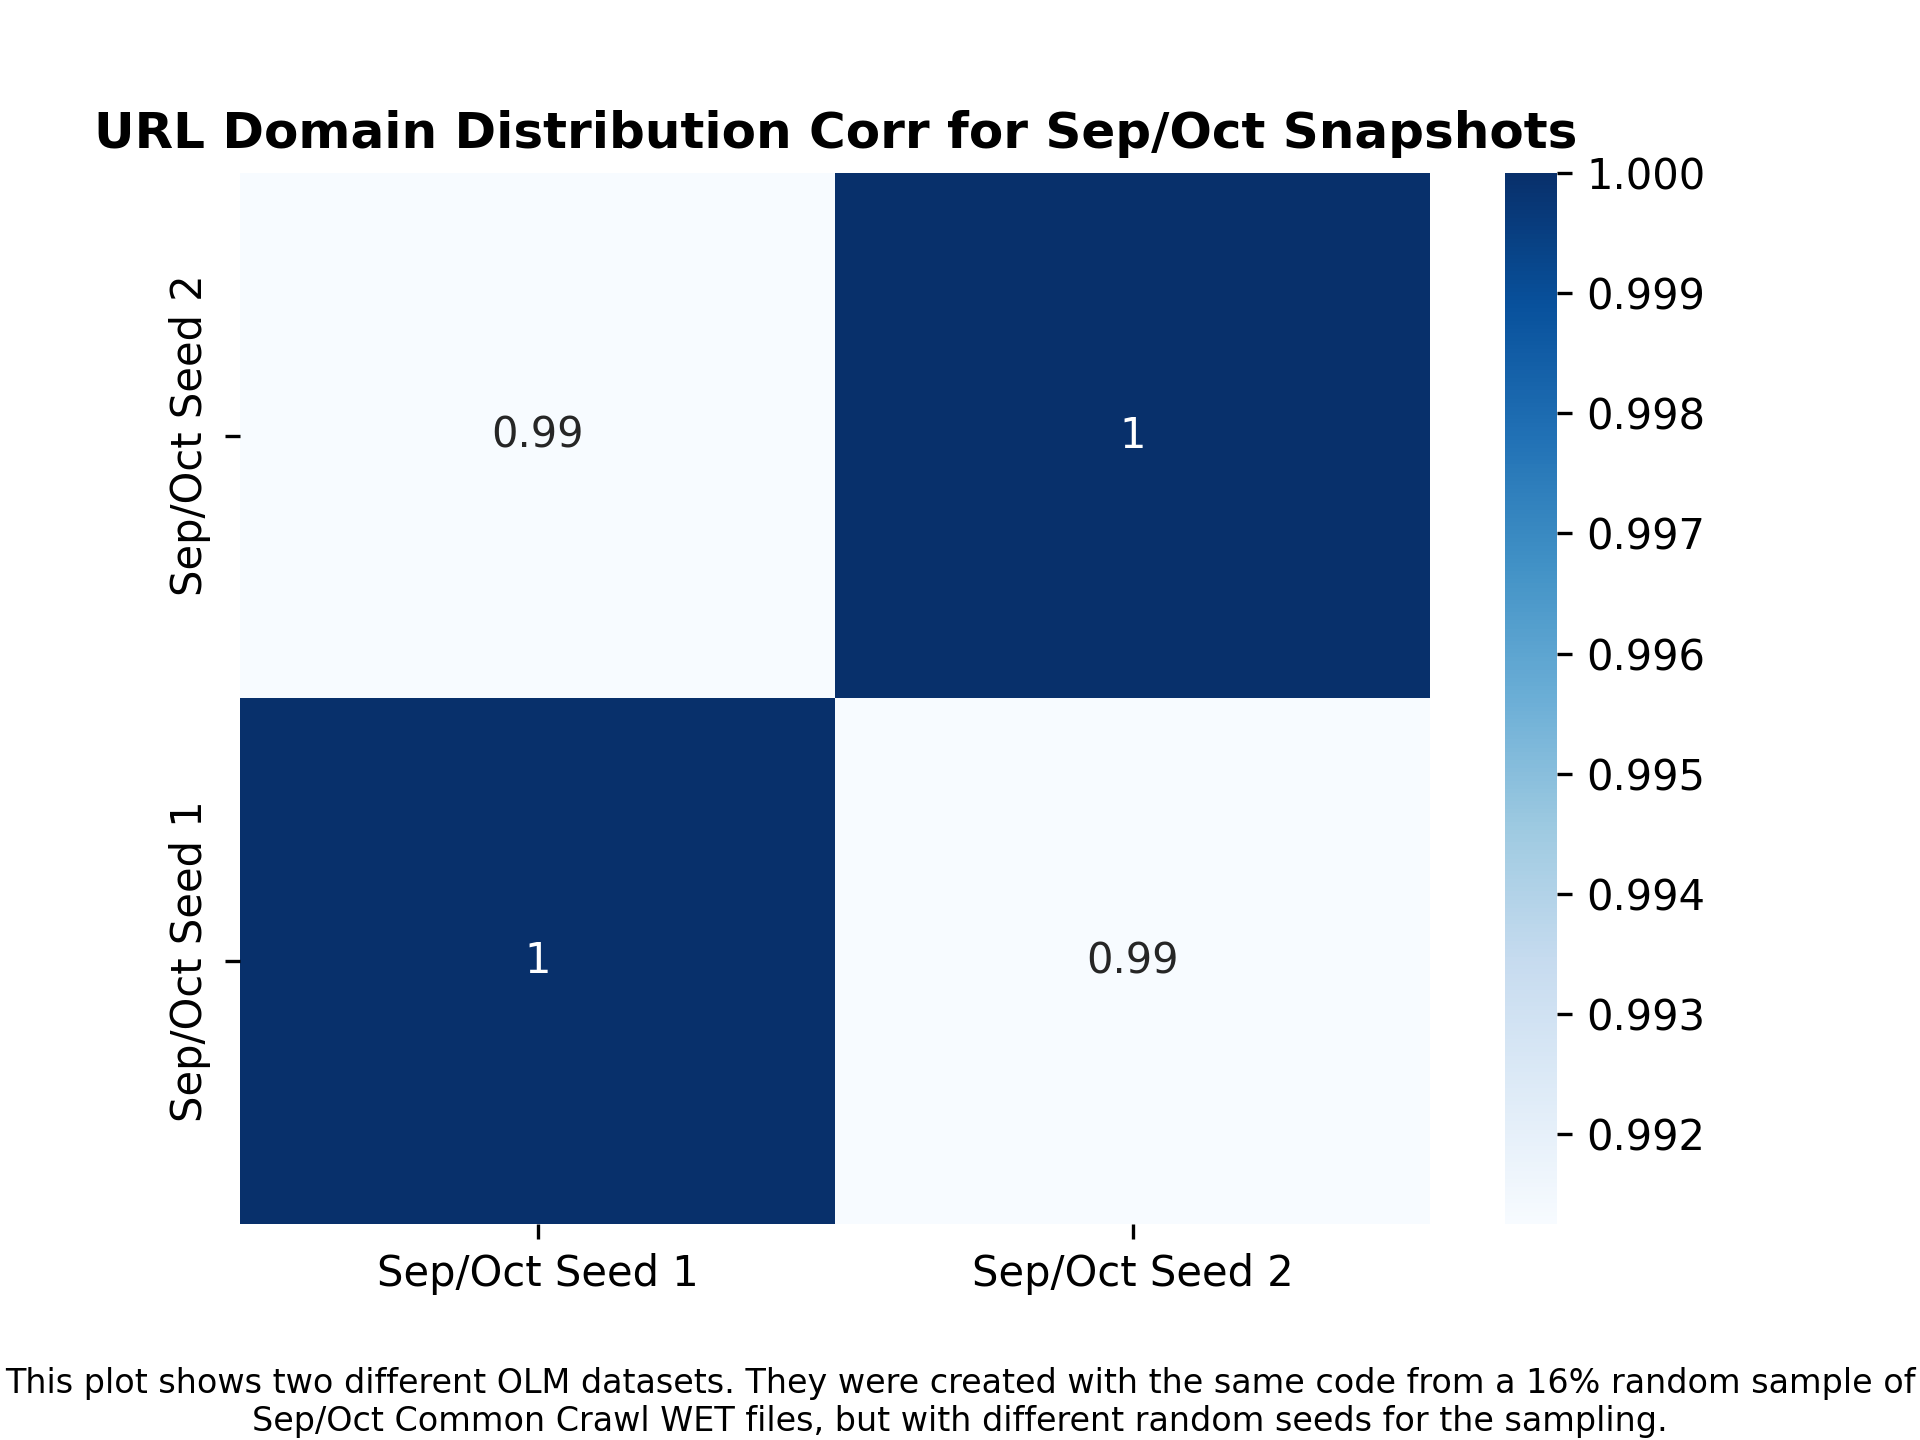
Does sampling about 15-20% of a Common Crawl Snapshot do anything surprising? How much correlation is there between the resulting OLM dataset from a Common Crawl sample from a random seed versus another random seed? This command reports the domain correlation between two Sep/Oct datasets where the only difference is the sampled segments based on different random seeds:
python url_dist.py --input_dataset_names Tristan/olm-CC-MAIN-2022-40-sampling-ratio-0.15894621295 Tristan/olm-CC-MAIN-2022-40-sampling-ratio-0.15894621295-seed-69 --input_dataset_pretty_names "Sep/Oct Seed 1" "Sep/Oct Seed 2" --url_column url --hist_plot_title "URL Domain Distribution for Sep/Oct Snapshots" --corr_plot_title "URL Domain Distribution Corr for Sep/Oct Snapshots" --num_proc=224 --output_corr_filename url_corr_sep_oct_different_seeds.png --output_hist_filename url_hist_sep_oct_different_seeds.png --load_from_hub_instead_of_disk --cache_dir url_dist_cache_all --annotation="This plot shows two different OLM datasets. They were created with the same code from a 16% random sample of Sep/Oct Common Crawl WET files, but with different random seeds for the sampling."
Here is the resulting figure:
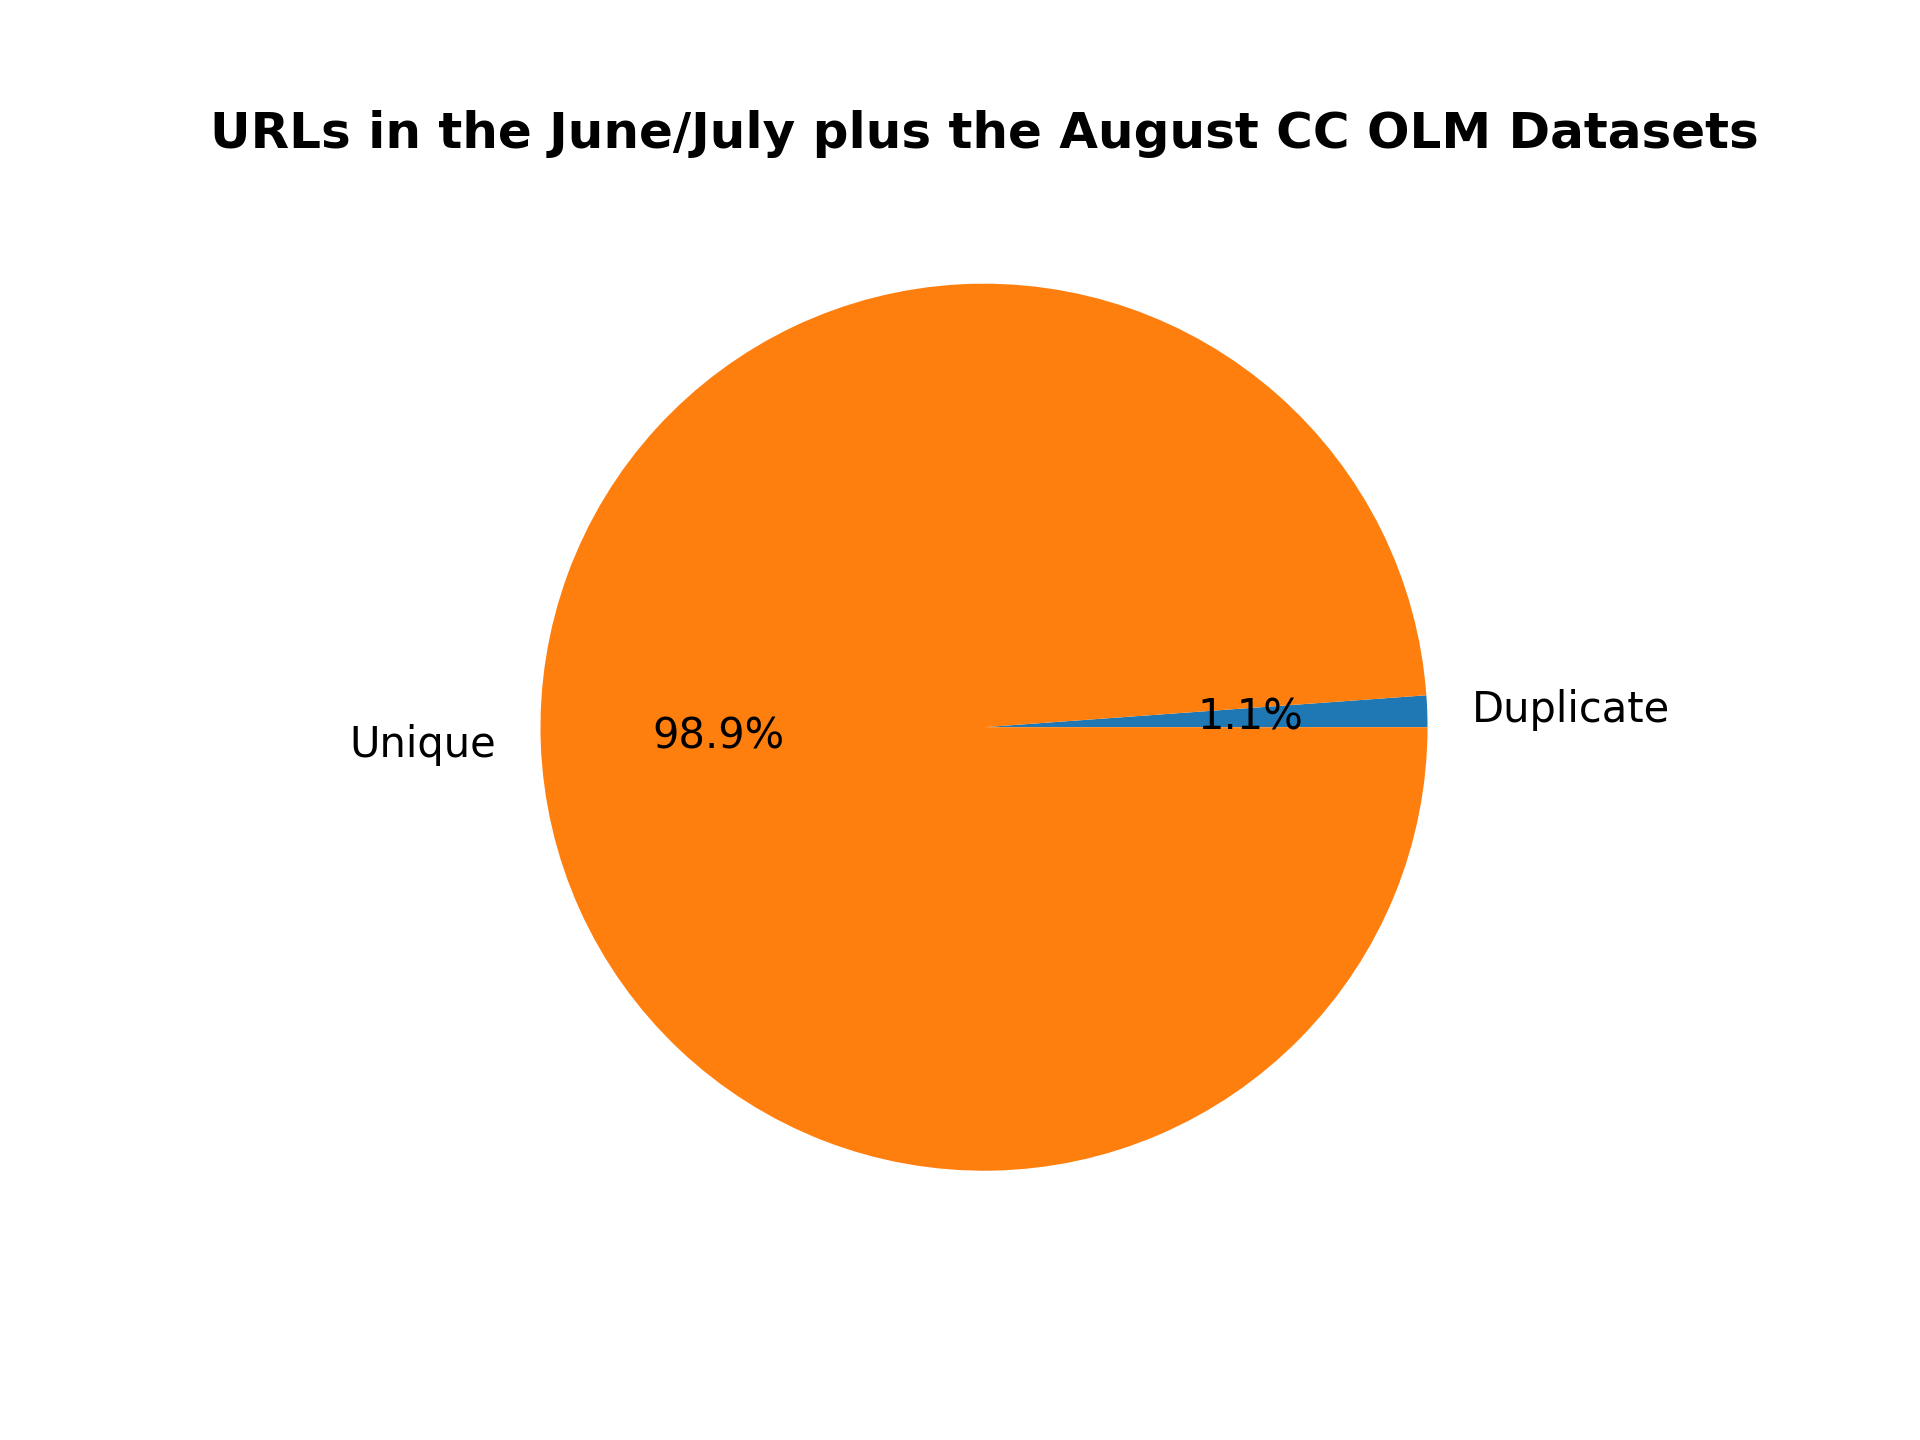
This command reports the ratio of shared URLs between the August and June/July Common Crawl OLM Datasets:
python duplicates.py --input_dataset_names Tristan/olm-CC-MAIN-2022-33-sampling-ratio-0.20 Tristan/olm-CC-MAIN-2022-27-sampling-ratio-0.16142697881 --analysis_column=url --split=train --num_proc=224 --plot_title="URLs in the June/July plus the August CC OLM Datasets" --output_filename=duplicate_urls_aug_jun_jul.png --load_from_hub_instead_of_disk
Here is the resulting figure:
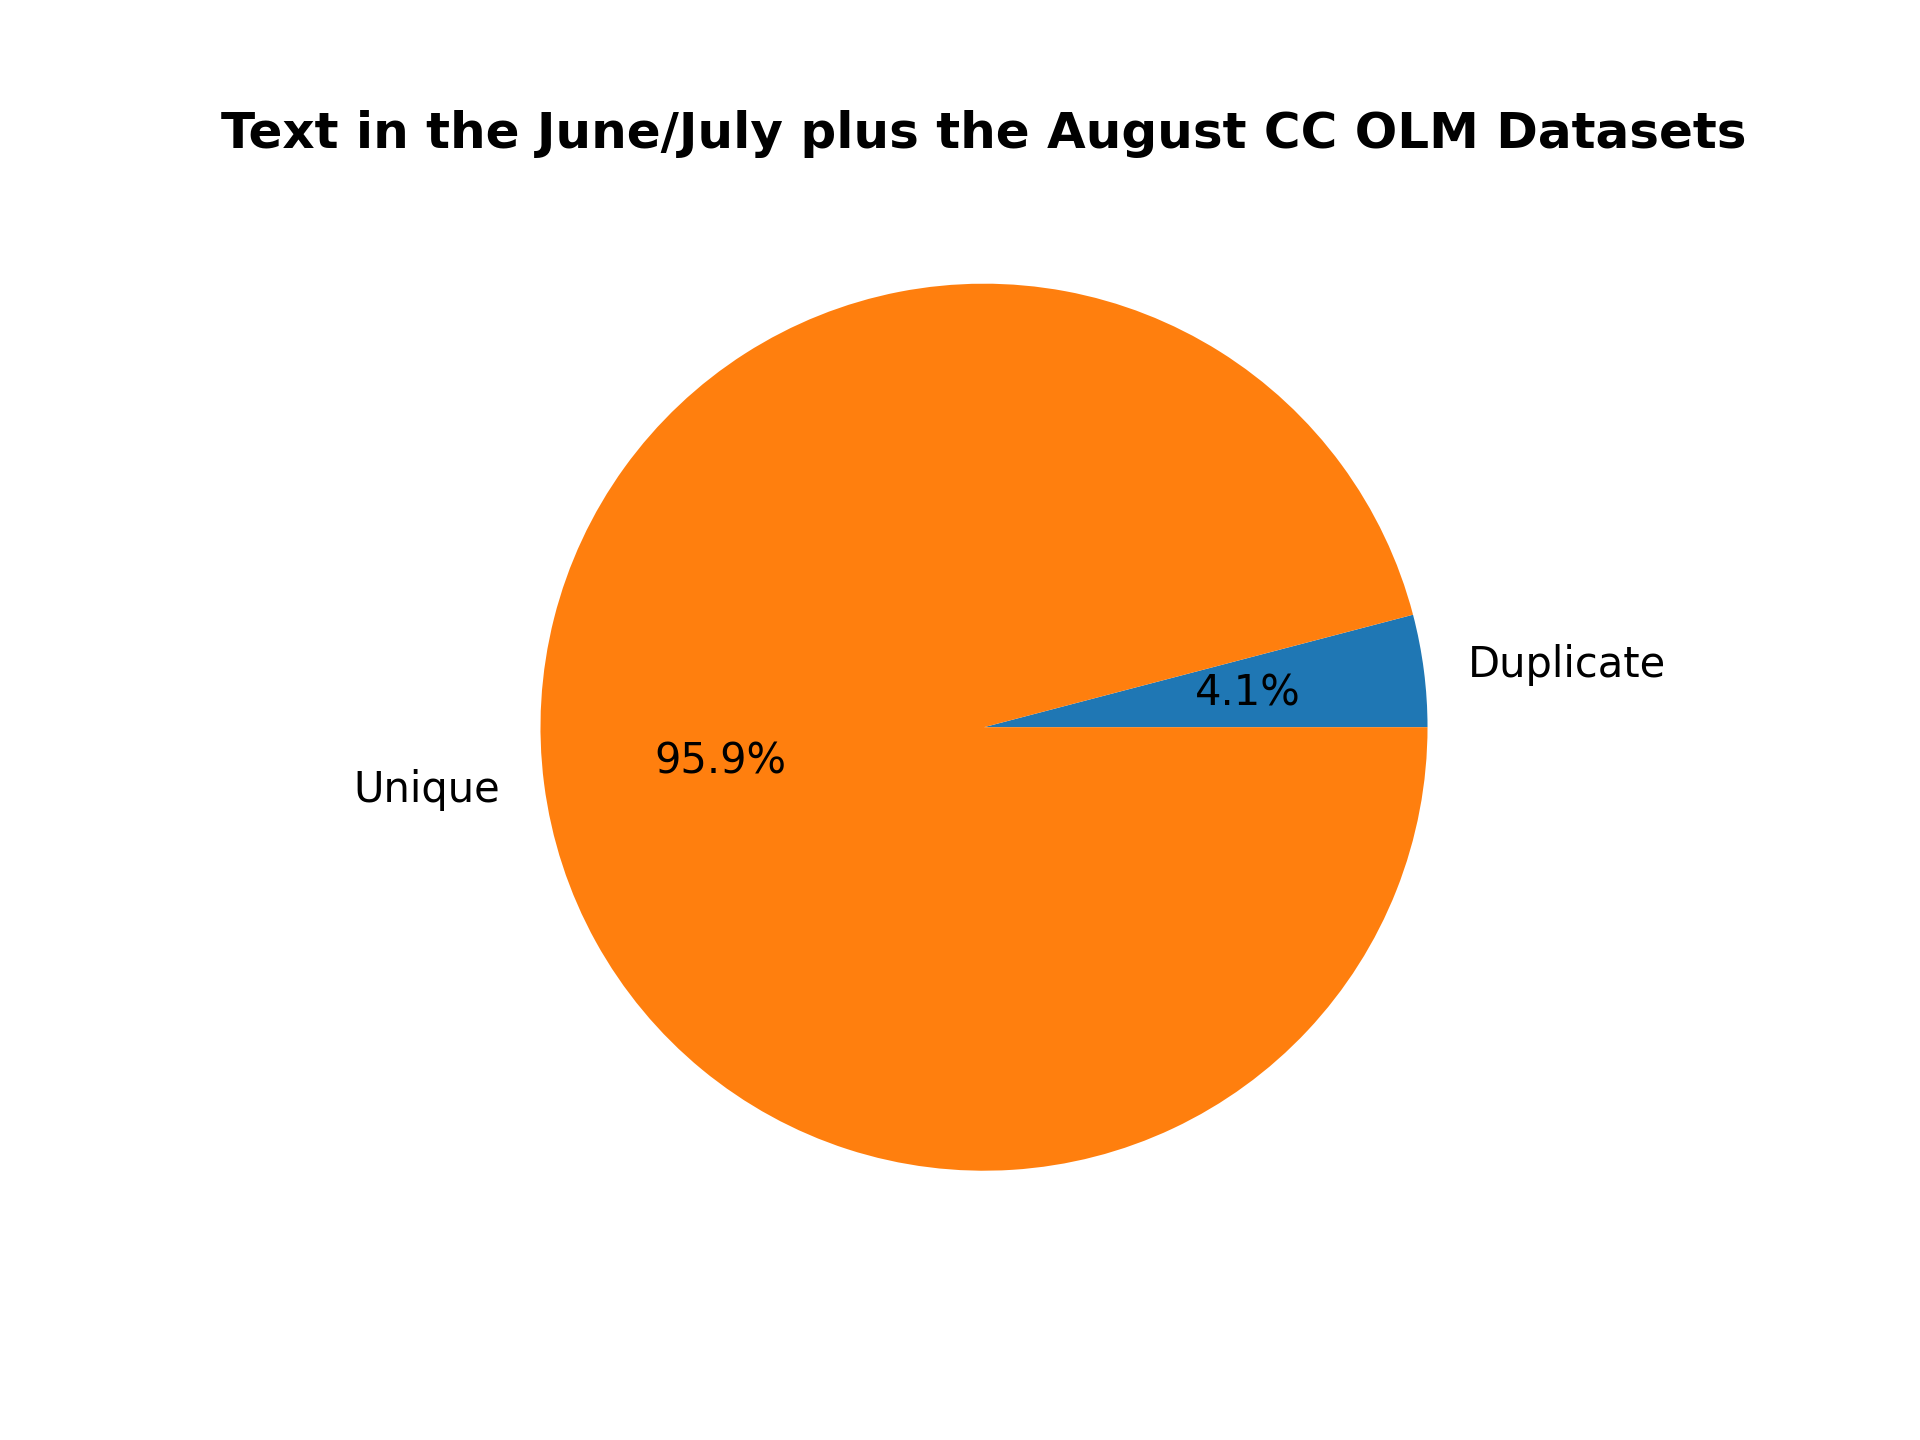
This command reports the ratio of exact text duplicated between the August and June/July Common Crawl OLM Datasets:
python duplicates.py --input_dataset_names Tristan/olm-CC-MAIN-2022-33-sampling-ratio-0.20 Tristan/olm-CC-MAIN-2022-27-sampling-ratio-0.16142697881 --analysis_column=text --split=train --num_proc=224 --plot_title="Text in the June/July plus the August CC OLM Datasets" --output_filename=duplicate_text_aug_jun_jul.png --load_from_hub_instead_of_disk
Here is the resulting figure:
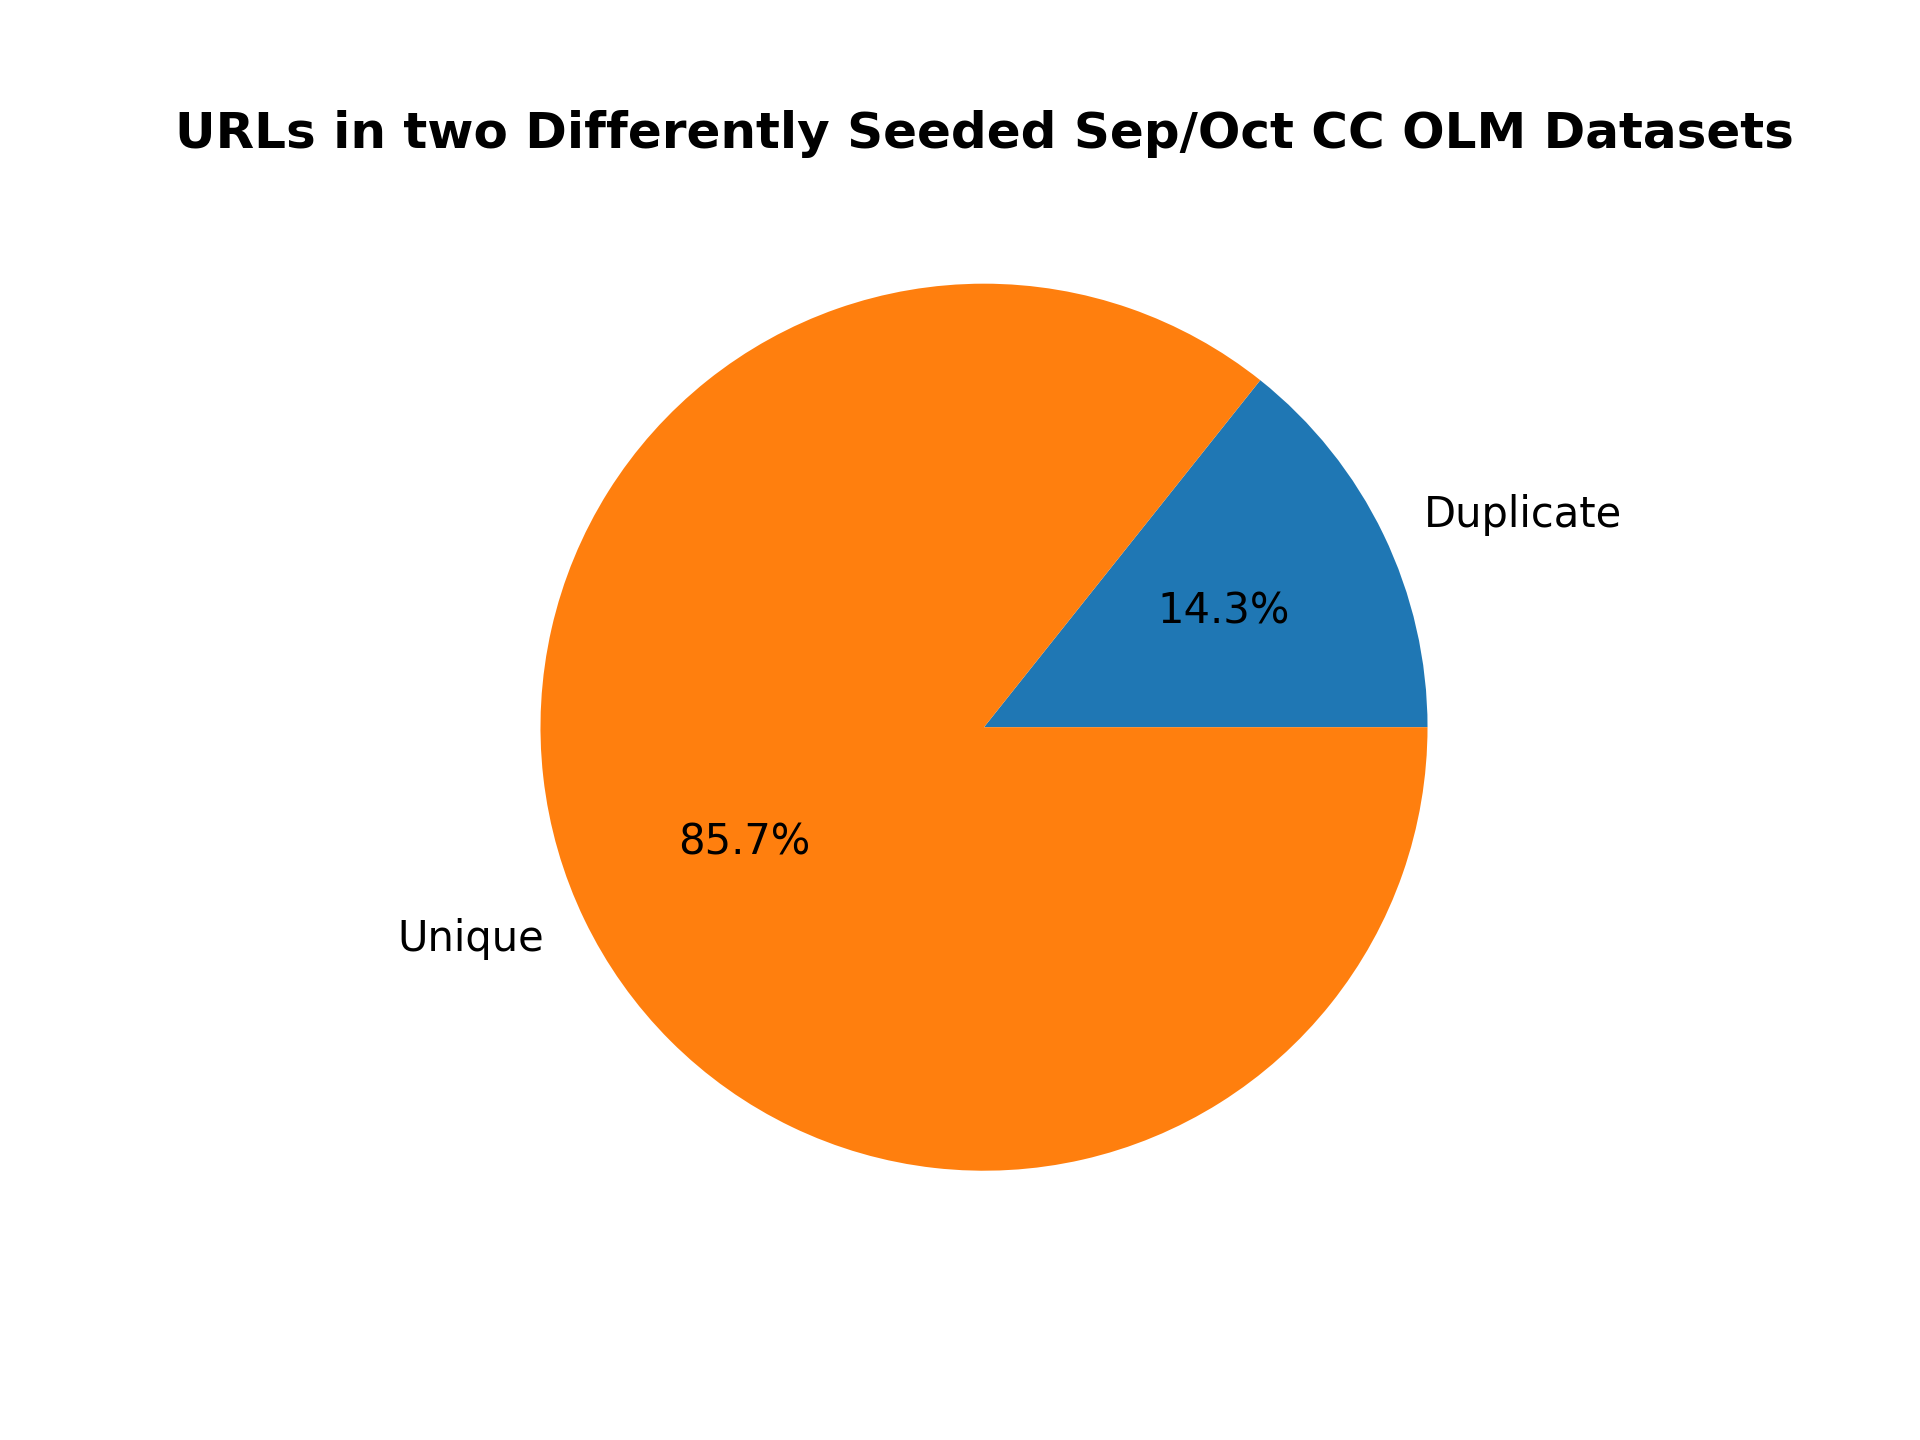
What about the duplicated URLs between two differently seeded OLM datasets from the same month?
python duplicates.py --input_dataset_names Tristan/olm-CC-MAIN-2022-40-sampling-ratio-0.15894621295 Tristan/olm-CC-MAIN-2022-40-sampling-ratio-0.15894621295-seed-69 --analysis_column=url --split=train --num_proc=224 --plot_title="URLs in two Differently Seeded Sep/Oct CC OLM Datasets" --output_filename=duplicate_urls_sep_oct_different_seeds.png --load_from_hub_instead_of_disk
Here is the resulting figure:
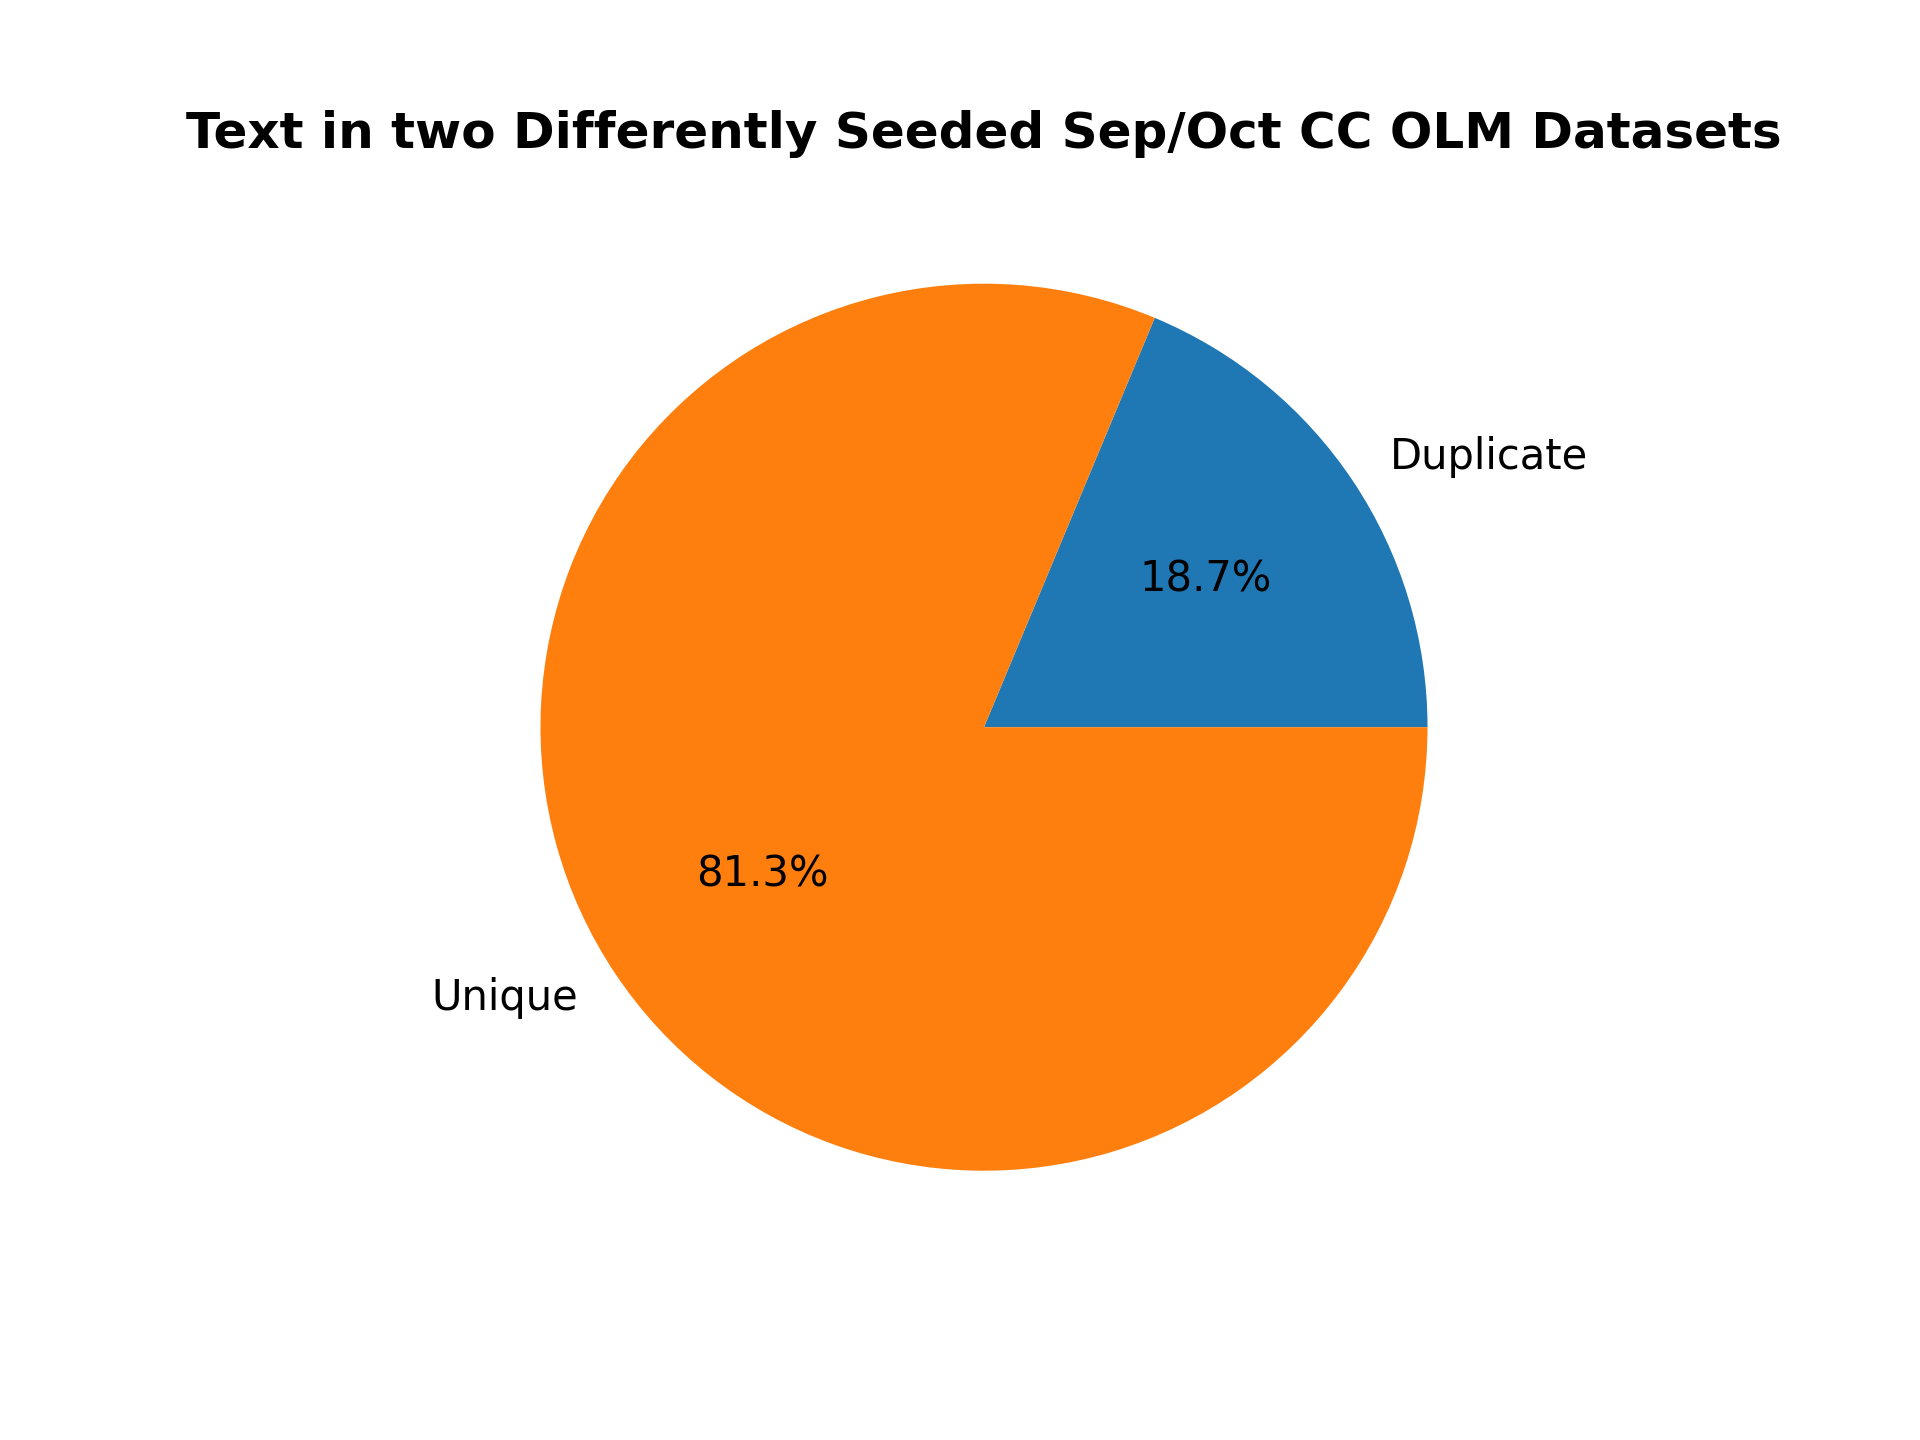
And what about the text?
python duplicates.py --input_dataset_names Tristan/olm-CC-MAIN-2022-40-sampling-ratio-0.15894621295 Tristan/olm-CC-MAIN-2022-40-sampling-ratio-0.15894621295-seed-69 --analysis_column=text --split=train --num_proc=224 --plot_title="Text in two Differently Seeded Sep/Oct CC OLM Datasets" --output_filename=duplicate_text_sep_oct_different_seeds.png --load_from_hub_instead_of_disk
python term_counts.py --help
python url_dist.py --help
python timestamp_dist.py --help
python duplicates.py --help